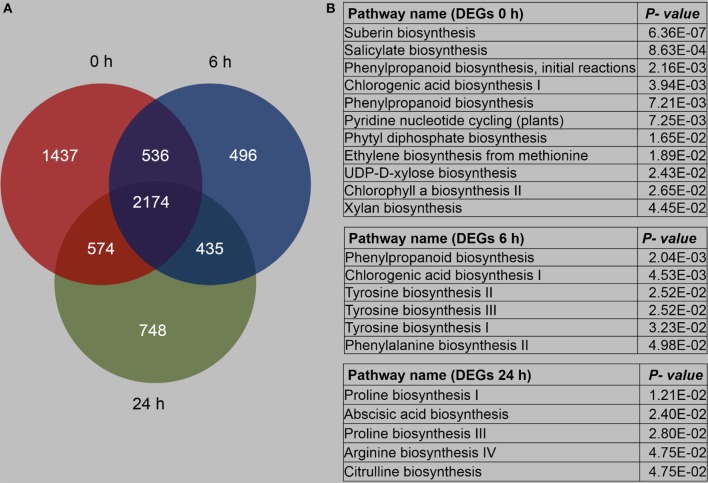
Figure 6.
Overview of differentially expressed genes between B73 and Mo17. The fourth maize leaves were each treated with 50 aphids, and samples were collected at 6 and 24 h; untreated leaves served as controls (0 h). (A) Number of genes with differentially expressed levels between B73 and Mo17. (B) Pathway enrichment analysis using MetGenMAP to identify metabolic functions that were differentially expressed between B73 and Mo17. Full descriptions can be found in Table S6.

