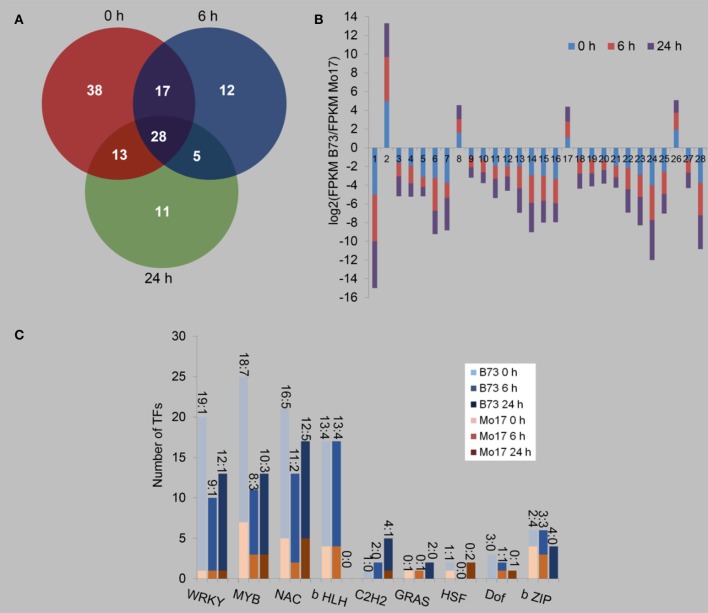
Figure 7.
Differentially regulated transcription factors between B73 and Mo17 with and without R. padi treatment. The fourth maize leaves were each treated with 50 aphids, and samples were collected at 6 and 24 h (untreated leaves served as controls, depicted as 0 h). (A) Venn diagram indicating the number of differently expressed transcription factors (TFs) between B73 and Mo17 at each time point. (B) Expression profiles of the 28 common regulated TFs (X-axis represent randomly assigned gene numbers, and their gene IDs are in Table S7). (C) Distribution of the families of TF differentially regulated between B73 and Mo17, in control, at 6 and 24 h of R. padi herbivory-treated samples. On top of each bar, the number before the colon indicates the number of TFs that had greater expression in B73 than in Mo17, and the number after the colon indicates the number of TFs whose expression were lower in B73 than in Mo17. Full descriptions can be found in Table S7.

