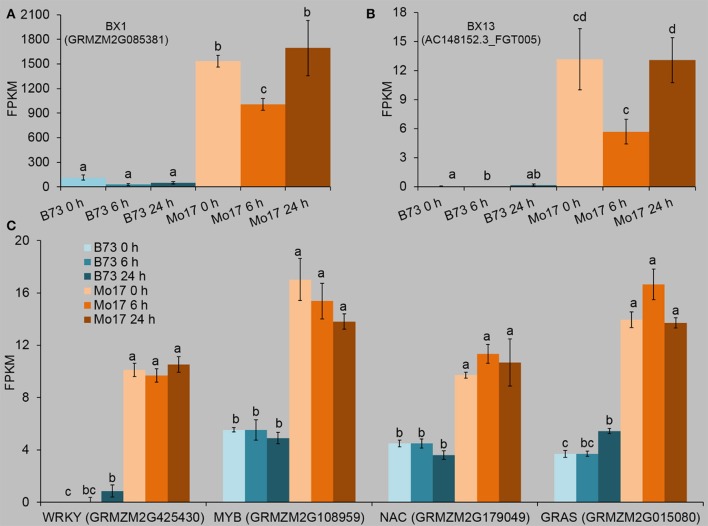
Figure 8.
Expression profiles of Bx biosynthetic genes and transcription factors whose expression patterns were correlated with that of BX1. The fourth maize leaves were each treated with 50 aphids per plant, and samples were collected at 6 and 24 h after R. padi treatment (untreated leaves served as controls, depicted as 0 h). Relative changes of the transcript levels of BX1 (A) and BX13 (B). Data were extracted from the FPKM values of the target genes in the RNA-seq datasets. (C) Transcription factors (TFs) which showed similar expression patterns to that of BX1. Values = means ± SE; n = 3; different letters above bars indicate significant differences (one-way ANOVA Duncan's multiple range test; P < 0.05). Full descriptions can be found in Table S7.

