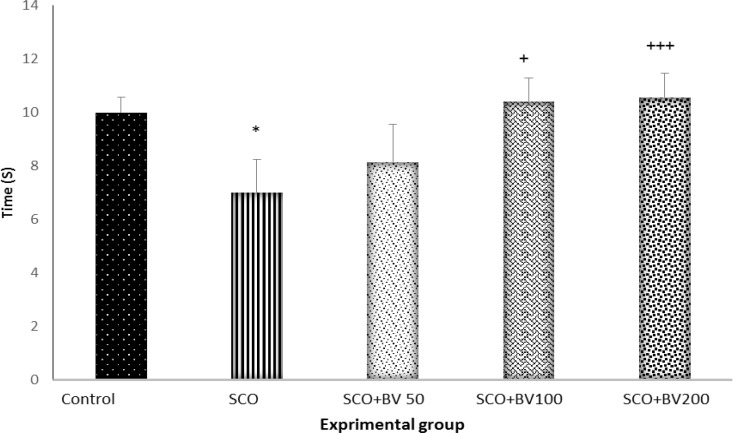
Figure 1.
The time spent in target quadrant during the probe trial; the data are expressed as mean ± SD; n = 10 in each group; SCO+BV= scopolamine+ B. vulgaris. * shows significant difference compared to control group (*P<0.05); + shows significant difference compared to scopolamine group (+++p<0.001; +P<0.05

