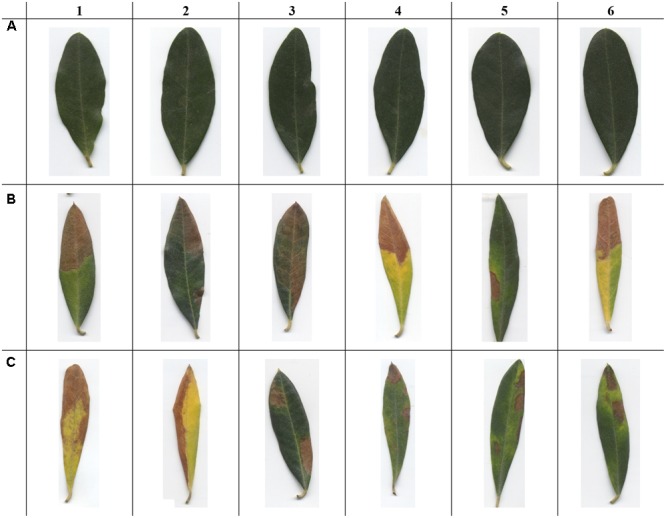
FIGURE 4.

Examples images of Olea europaea L. used in this study. (A) Healthy control (asymptomatic leaves); (B) OQDS-symptomatic leaves (Xylella fastidiosa-positive samples); (C) X. fastidiosa-negative samples showing another pathogen/disorder. Note that the images given here are the native, original aspect ratio of O. europaea L. leaves. It is easy to distinguish healthy leaves from non-healthy leaves (A vs. B or C). However, tissue desiccation on the leaf tip, if it occurs, is not exclusive to OQDS (C1, C4, and C6), thus it is challenging to detect the difference between OQDS and non-OQDS samples (B vs. C).
