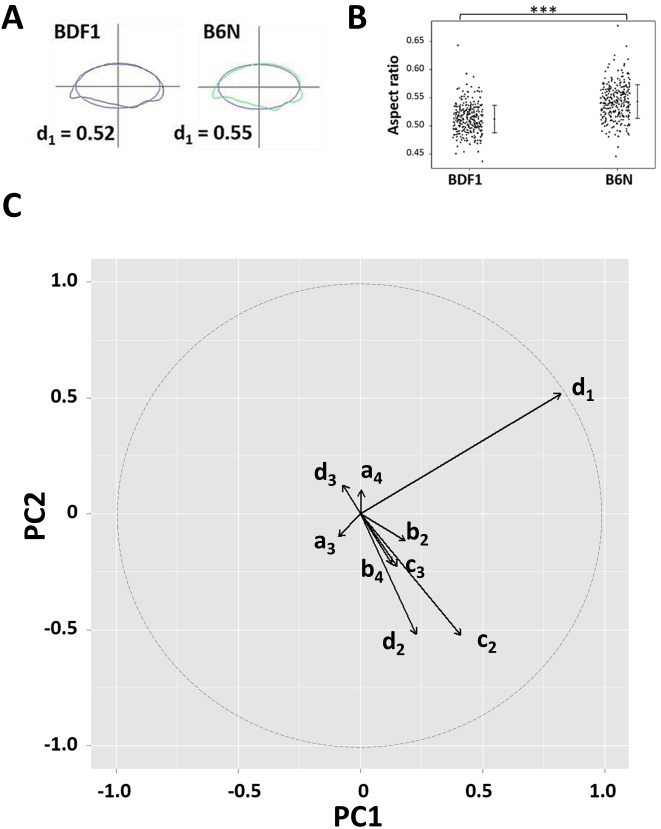
Figure 3. The sperm head aspect ratio was the largest contributor to the first principal component.
(A) Representative sperm head shapes of BDF1 (gray) and B6N (green) epididymis-isolated spermatozoa are shown with the overlapping ellipse (blue) used to calculate population mean of the aspect ratio (d1 in Eq. (1)). (B) A dot plot shows the aspect ratio of the heads from BDF1 and B6N spermatozoa. The error bars denote the standard deviation (SD). (C) The arrows show the eigenvectors of the PC projected into PC1-PC2 space, whose length (the square-root of the sum of the square of the factor loadings of PC1 and PC2) is greater than 0.1, and where the dashed circle denotes the norm of the eigenvector = 1.

