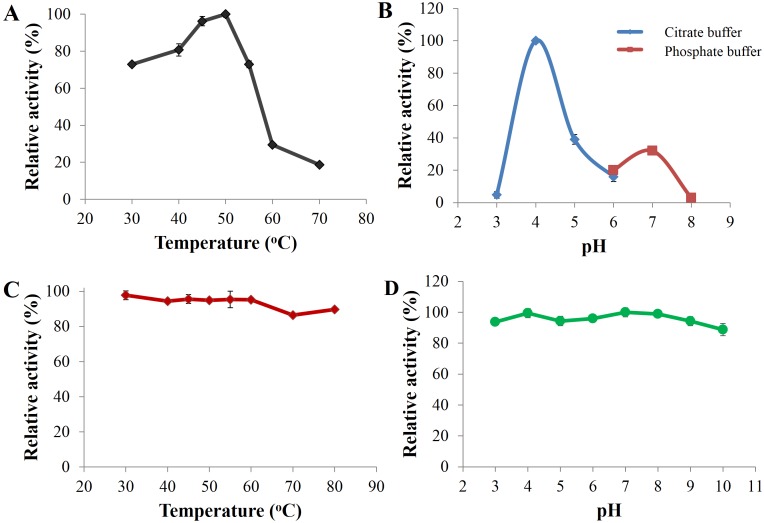
Figure 5. Enzyme activity profiles of CbhB.
(A) CbhB activity profile over a range of temperatures displaying the optimum temperature, (B) CbhB activity profile over a range of pH showing the optimum pH, (C) CbhB activity profile showing thermostability after exposure to different temperatures (30, 40, 45, 50, 55, 60, 70, 80°C) for 30 min and (D) CbhB activity profile displaying pH stability after exposure to various pH (pH 3 to 10) for 30 min. All assays were performed using 4-methylumbelliferyl β-D-cellobioside (MUC) as the substrate.

