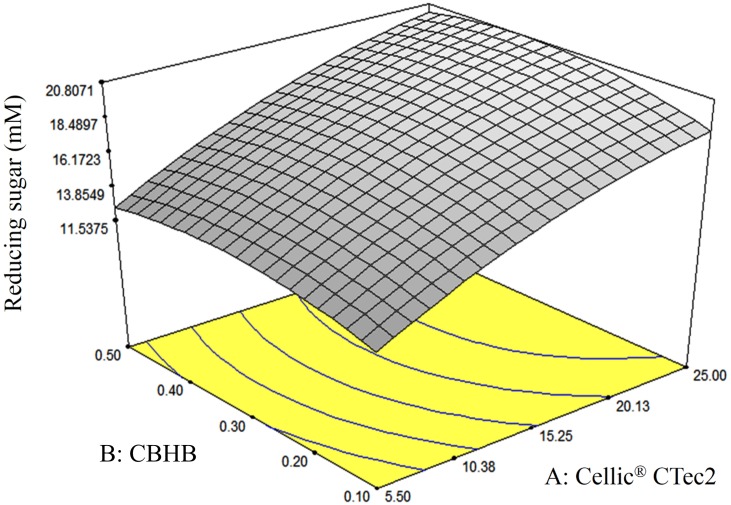
Figure 8. Response surface diagrams of oil palm empty fruit bunch (OPEFB) hydrolyses using various loadings of Cellic® CTec2 (5.5–25%) and CBHB (0.1–0.5%).
Production of reducing sugars was measured using DNS assays (Section 2.5). The contour lines are the two dimensional representation of the response surface. All points within the same contour line have equal reducing sugar concentration.

