Table 1.
Kinase inhibitory activity of paroxetine analogs
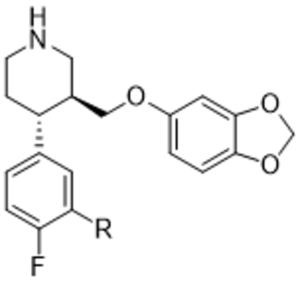 | ||||||
|---|---|---|---|---|---|---|
| R | Compound | GRK2 IC50 (μM)a |
GRK1 IC50 (μM)a |
GRK5 IC50 (μM)a |
PKA IC50 (μM)a |
ROCK1* |
| H | Paroxetine | 1.38±1.00 | > 100 | > 100 | > 100 | 10% |
| 1 | 0.02±0.001 | 9.1±3.2 | 2.2±0.9 | ND | ND | |
| 2 | 0.03±0.006 | 52.1±26.3 | 9.2±3.0 | ND | ND | |
| 3 | 0.77±0.5 | > 100 | > 100 | 30±19 | 65% | |
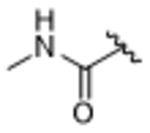 |
14aa | 2.1±0.72 | > 100 | > 100 | > 100 | 11% |
 |
14ab | 0.77±0.17 | > 100 | 84.3±35.8 | > 100 | 17% |
 |
14ac | 2.68±2.11 | > 100 | > 100 | > 100 | 22% |
 |
14ad | 1.53±0.49 | > 100 | 37.2±28.9 | > 100 | 34% |
 |
14ae | 2.03±0.33 | > 100 | 10.2±1.8 | > 100 | 0% |
 |
14af | 12.4±7.7 | > 100 | 75.7±39.9 | > 100 | 5% |
 |
14ag | 2.17±0.79 | 24.5±19.6 | 42.3±16.3 | > 100 | 0% |
 |
14ah | 1.76±1.43 | 25.8±16.1 | 33.2±2.48 | > 100 | 0% |
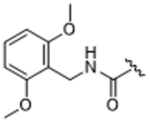 |
14ai | 2.04±1.02 | 32.0±14.0 | 38.4±16.1 | >100 | 13% |
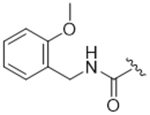 |
14aj | 37.7±9.14 | > 100 | > 100 | > 100 | 1% |
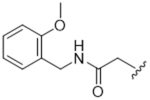 |
14ba | 2.37±2.27 | > 100 | > 100 | 25.8±25 | 18% |
 |
14ak | 0.61±0.12 | > 100 | 17.1±5.9 | > 100 | 6% |
 |
14al | 1.52±0.78 | > 100 | 76.3±15.3 | > 100 | 6% |
 |
14am | 2.04±0.74 | > 100 | > 100 | > 100 | 8% |
 |
14an | 3.28±1.8 | > 100 | > 100 | > 100 | 15% |
 |
14ao | 3.02±0.99 | > 100 | > 100 | > 100 | 18% |
 |
14ap | 3.24±1.0 | > 100 | > 100 | > 100 | 21% |
 |
14bb | 6.01±2.08 | 60.0±2.07 | > 100 | 48.2±35 | 0% |
 |
14bc | 5.9±3.2 | > 100 | > 100 | > 100 | 0% |
 |
14aq | 0.75±0.32 | > 100 | 14.8±3.2 | > 100 | 18% |
 |
14ar | 0.6±0.21 | > 100 | > 100 | > 100 | 11% |
 |
14as | 0.03±0.001 | 87.3±27.9 | 7.09±0.73 | > 100 | 9% |
 |
14at | 0.77±0.20 | > 100 | > 100 | > 100 | 18% |
 |
14au | 0.03±0.02 | 86.5±7.0 | 4.0±0.52 | > 100 | 12% |
 |
14av | 1.25±0.30 | > 100 | > 100 | > 100 | 17% |
 |
14aw | 2.11±0.52 | > 100 | > 100 | > 100 | 14% |
 |
14ax | 0.39±0.11 | > 100 | > 100 | > 100 | 19% |
 |
14ay | 16.7±5.4 | > 100 | > 100 | > 100 | 13% |
 |
14bd | 0.63±0.33 | > 100 | > 100 | > 100 | 27% |
All IC50 measurements are an average of three separate experiments run in duplicate. Errors shown represent error of the mean.
Percent inhibition at 10 μM inhibitor concentration. ND, not determined.
