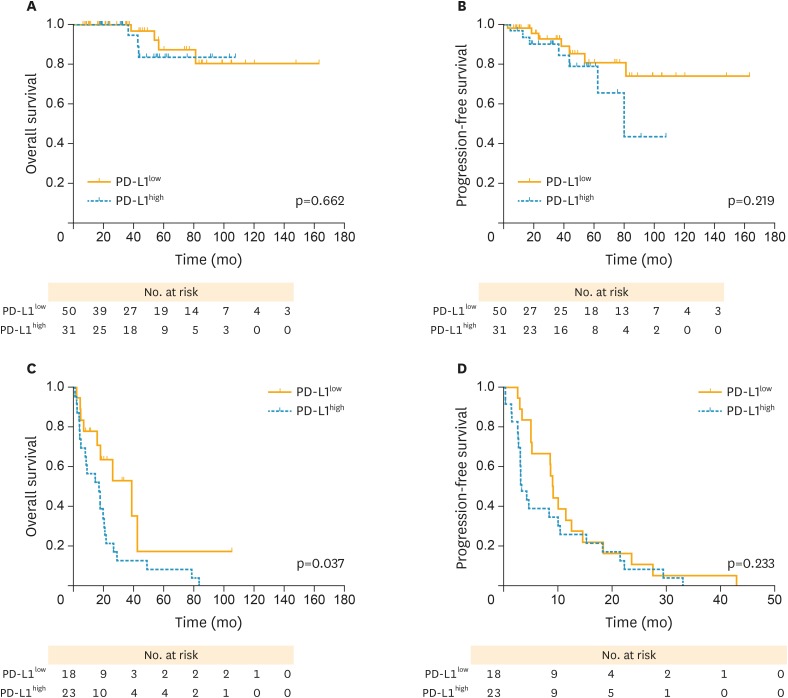
Fig. 5.
PFS and OS curves stratified by the sensitivity to chemotherapy between high and low PD-L1 expression (yellow solid lines, PD-L1low; blue dotted lines, PD-L1high, respectively). (A) OS curves between high and PD-L1low in PS cases. (B) PFS curves between high and PD-L1low in PS cases. (C) OS curves between high and PD-L1low in PR cases. (D) PFS curves between high and PD-L1low in PR cases. Patients with PD-L1high revealed a worse OS and PFS compared with those with PD-L1low in PR cases, with significant differences observed.
OS, overall survival; PD-L1, programmed death-ligand 1; PD-L1high, high PD-L1 expression; PD-L1low, low PD-L1 expression; PFS, progression-free survival; PR, platinum-resistant; PS, platinum-sensitive.

