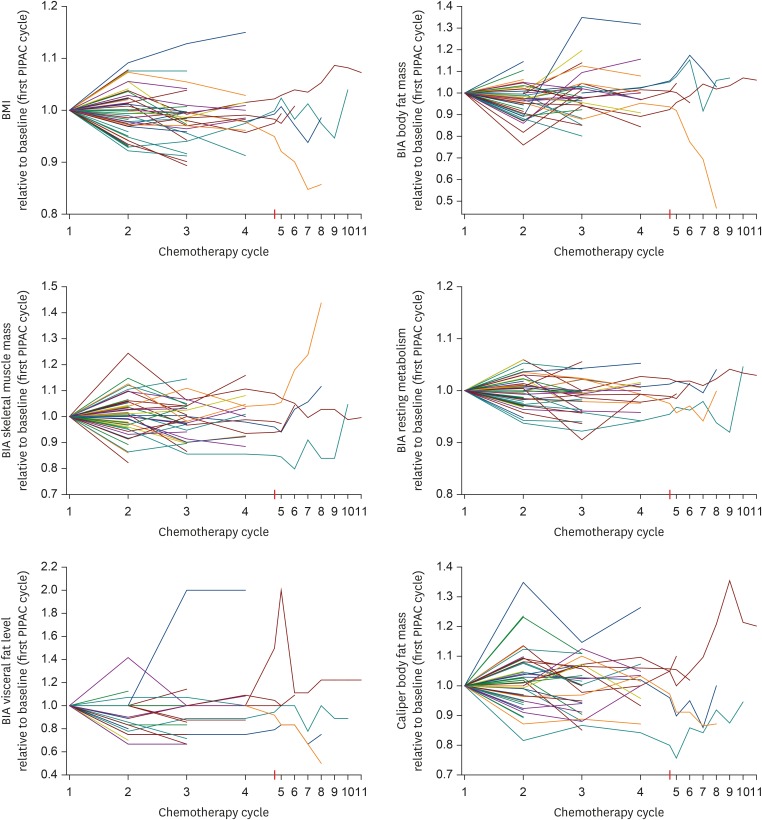
Fig. 2.
Line diagrams of all individual patients depicting longitudinal changes of RM, body fat mass, visceral fat level, skeletal muscle mass, and caliper body fat relative to the baseline values.
BIA, bioelectrical impedance analysis; BMI, body mass index; PIPAC, pressurized intraperitoneal aerosol chemotherapy; RM, resting metabolism.

