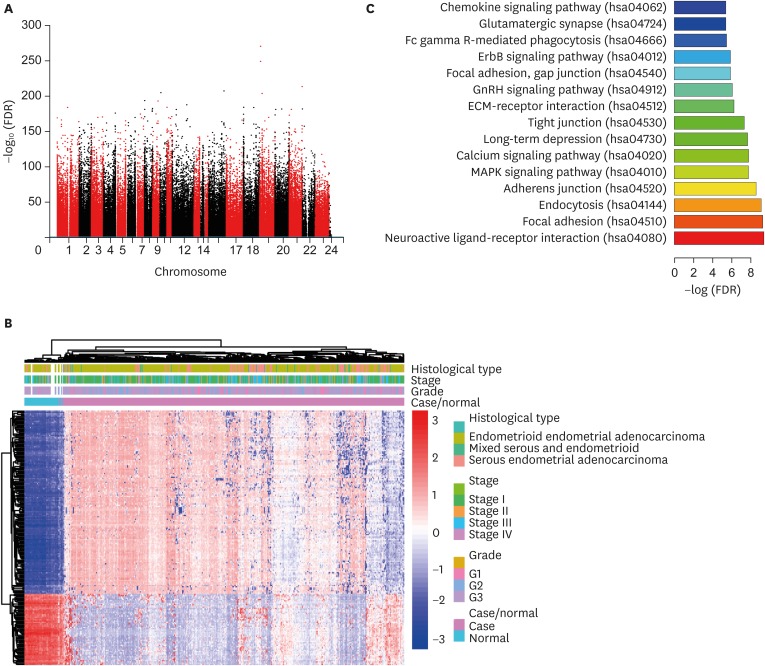
Fig. 1.
DNA methylation profile of EC. (A) Manhattan plot of CpG sites in 450K array. Dots above the purple line presented CpG sites with FDR<0.05. (B) Heatmap of top 200 DMCs (by FDR rank) base on the unsupervised hierarchical clustering analysis. (C) Visualization of KEGG pathway of DMCs.
DMCs, differentially methylated CpG sites; EC, endometrial cancer; FDR, false discovery rate; KEGG, Kyoto Encyclopedia of Genes and Genomes.

