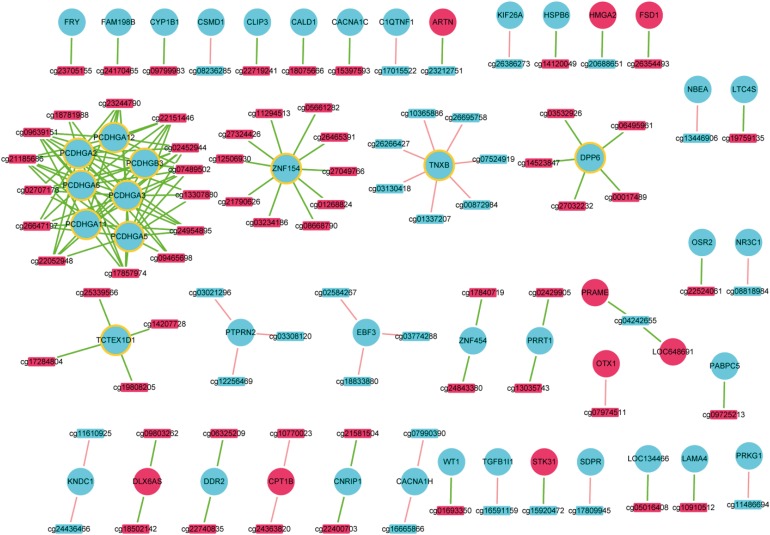
Fig. 2.
Correlation between DMCs and DEGs. Circles and rectangles represented DEGs and DMCs, respectively. Red colors mean up-regulated or hypermethylated, and turquoise means down-regulated or hypomethylated. Green lines represented the negative correlation, while pink lines represented positive correlation. Circles with orange margins were differentially methylated DEGs on the level of CGIs.
CGIs, CpG islands; DEGs, differentially expressed genes; DMCs, differentially methylated CpG sites.

