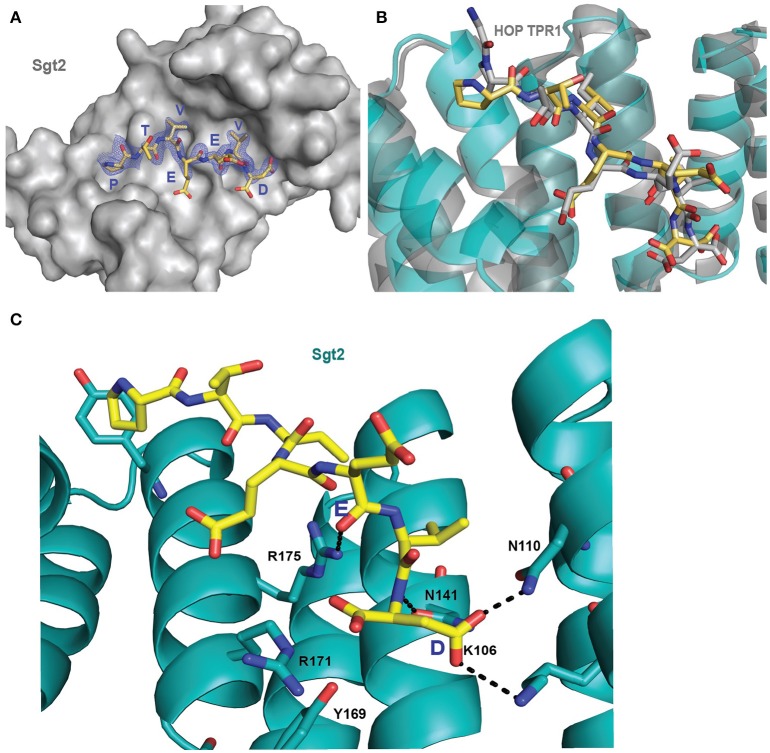
Figure 2.
Crystal structure of Sgt2_TPR/PTVEEVD complex. (A) The surface representation of Sgt2 hydrophobic groove with bound Ssa1 derived PTVEEVD peptide (PDB: 5LYP). The 2Fo-Fc map for the peptide was contoured at 1.0 σ. (B) Superimposition of Sgt2_TPR/PTVEEVD complex (peptide in yellow) onto Hsc70 peptide-bound HOP TPR1A (peptide in gray, PDB: 1ELW) highlighting similarities in peptide conformation at the binding interface. The peptides align with RMSD 0.52 Å. (C) Network of interactions formed at the complex interface (chain A and D). Residues shown as sticks are involved in the formation of hydrogen bonds or electrostatic interactions (shown as black dashed lines). Residues K106, N110, N141, R171, R175, and Y169 are involved in the formation of two-carboxylate clamp and M113 is involved in hydrophobic interactions.

