Figure 4.
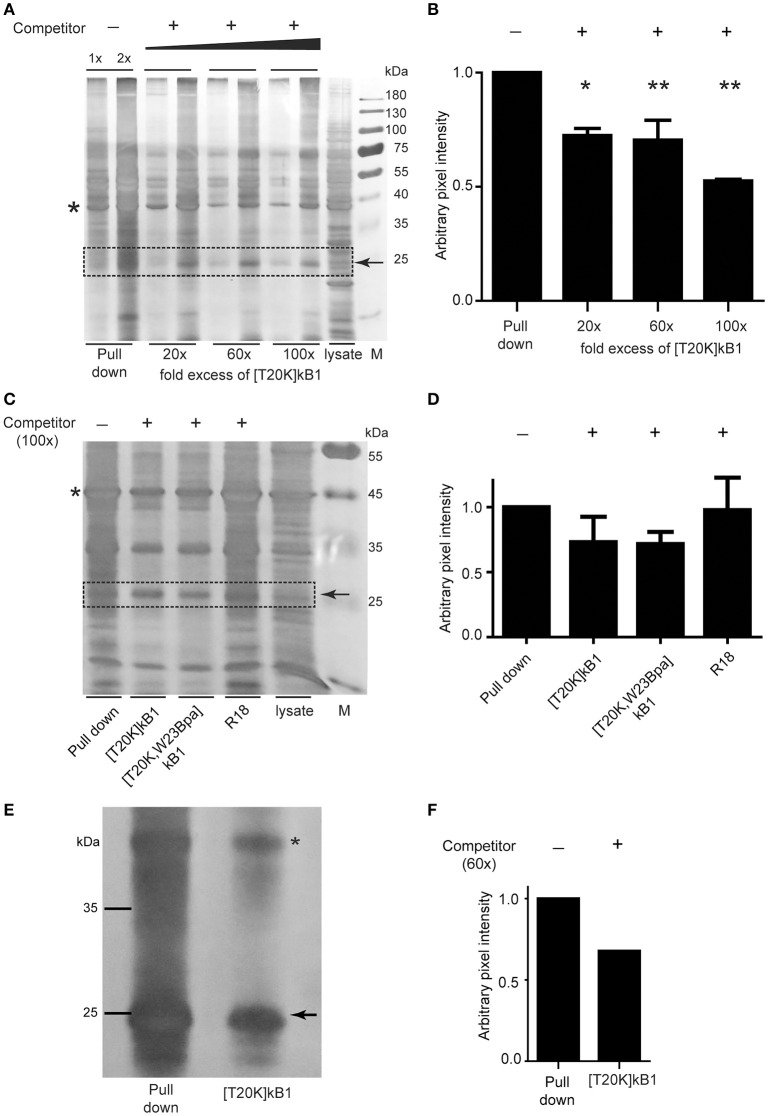
Photo-affinity capture of binding proteins with cyclotide probes and competitor titration for target identification. (A) Representative silver-stained gel image of Jurkat cell lysates probed with photo-affinity crosslinker [T20K,W23Bpa]kalata B1 (kB1) and pull down via biotin-linker in the absence (−) and presence (+) of bait competitor [T20K]kB1 at 20-, 60-, and 100-fold molar excess relative to the amount of [T20K,W23Bpa]kB1. (B) Exemplarily, a 25 kDa protein band that was affected in intensity by application of competitor which was semi-quantified relative to the pull down sample via pixel analysis of replicated silver gels using ImageJ. Values were normalized to a random internal loading control indicated with an asterisk. (C) Total soluble protein lysate isolated from MOG immunized mouse splenocytes (EAE disease inductions) were incubated with photo-affinity probe [T20K,W23Bpa]kB1, crosslinked and pulled down, with or without addition of various competitors [T20K]kB1, [T20K,W23Bpa]kB1 and pan-14-3-3 peptide inhibitor R18 (all at 100-fold molar excess). A representative silver stained protein gel is illustrated. (D) Semi-quantitative evaluation of the 25 kDa protein band via pixel analysis as described in (B). (E) Photo-affinity pull down experiment on living Jurkat cells in cell culture is illustrated via a silver stained protein gel. After 2 h of incubation with bait peptide and with or without the presence of 60-fold excess of competitor [T20K]kB1, the crosslinker was activated by UV-irradiation. Values were normalized to a random internal loading control indicated with an asterisk. (F) Semi-quantitative evaluation of the 25 kDa protein band via pixel analysis as described in (B).

