FIGURE 8.
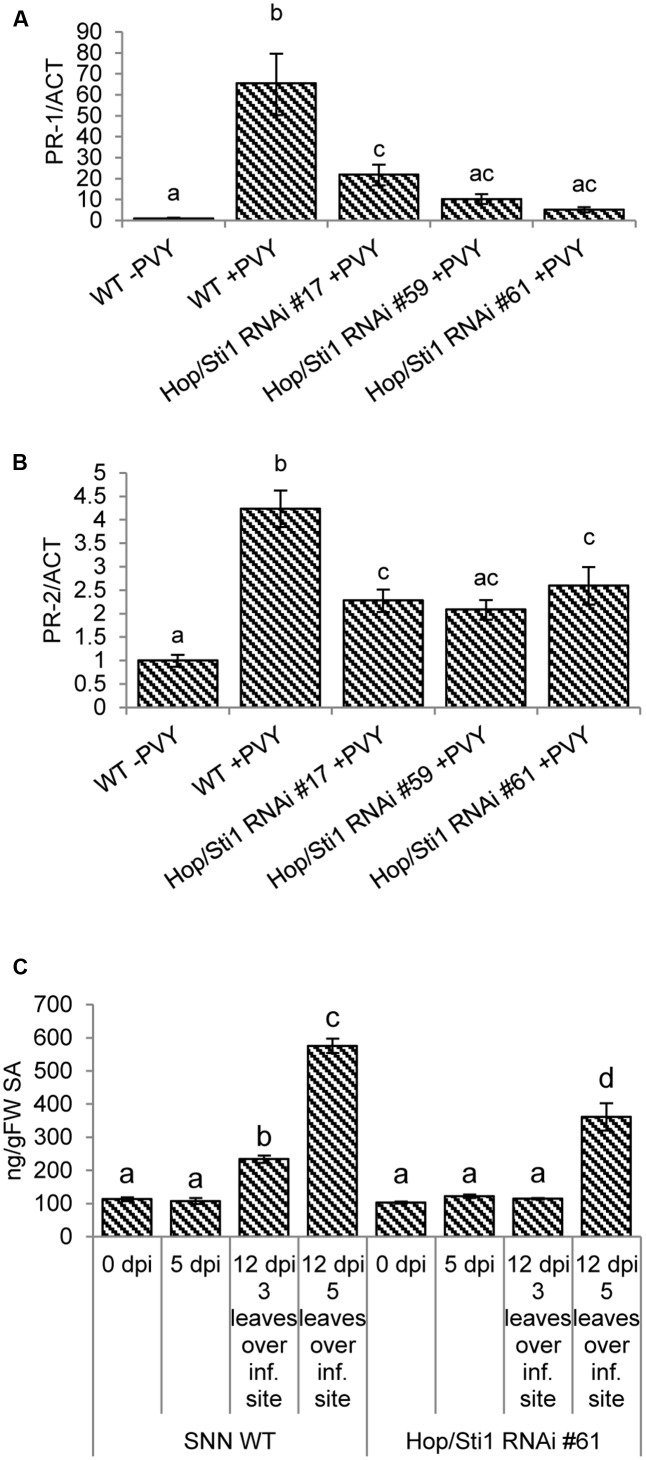
Impaired immune responses after PVYN inoculation in Hop/Sti1-RNAi plants. (A) PR-1 expression was analyzed by quantitative real-time PCR. The expression increased significantly (ANOVA, p-value: 1.2E–05) in samples derived from systemically infected wild-type leaves compared to non-infected samples. PR-1 expression in infected Hop/Sti1-RNAi lines was in all cases significantly (ANOVA, p-values of 3.9E–04, 4.9E–05, 2.2E–05 for lines #17, #59, and #61, respectively) lower than in infected wild-type plants. Error bars represent the standard error. Different letters indicate statistically significant differences (ANOVA, p < 0.05). (B) PR-2 expression was analyzed by quantitative real-time PCR. Infection of wild-type plants with PVYN led to a significant induction of PR-2 expression (ANOVA, p-value: 4.3E–05). Infected transgenic plants again showed a significantly (ANOVA, p-values of 2.6E–03, 1.3E–03, and 7.2E–03 for lines #17, #59, and #61, respectively) lower PR-2 expression than infected wild-type plants. Error bars represent the standard error. Different letters indicate statistically significant differences (ANOVA, p < 0.05). (C) Content of free salicylic acid (SA). In wild-type plants, SA levels increased significantly after 12 days three (ANOVA, p-value: 1.8E–03) and five (ANOVA, p-value: 2.3E–12) leaves over the initial inoculation site. At the same time, SA content in transgenic plants was not significantly altered three leaves over the inoculation site. Five leaves over the inoculation site, SA levels were significantly (ANOVA, p-value: 6.2E–07) lower compared to wild-type. Error bars represent the standard error. Different letters indicate statistically significant differences (ANOVA, p < 0.05).

