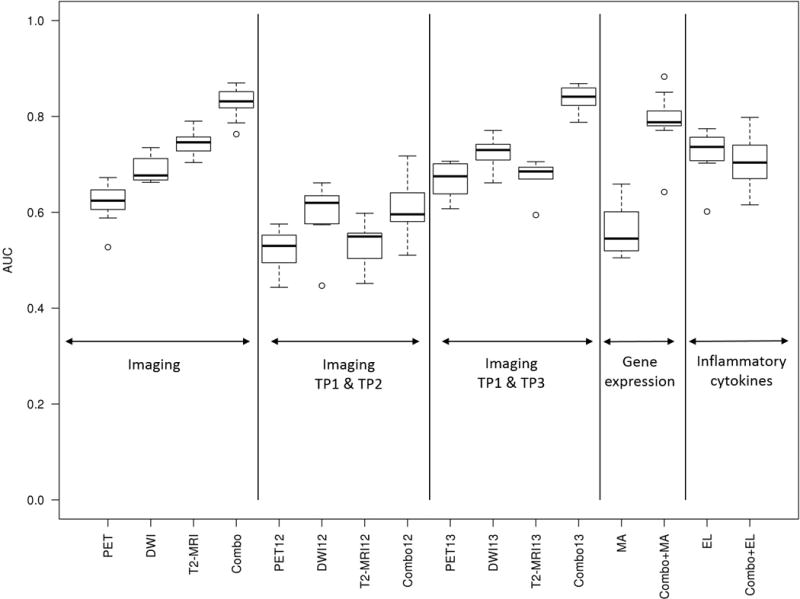
Figure 2. Models’ performance in prediction of ypT0-1N0 response.

Box plots showing the performance in terms of the AUC of the multivariate linear prediction models for several combinations of imaging, clinical and molecular data at different time points. Abbreviations: AUC = area under the ROC curve; EL = ELISA; MA = microarray gene expression signatures; ROC = Receiver Operating Characteristic; TP = time point; TP12 = combination of data obtained at TP1 and TP2; TP13 = combination of data obtained at TP1 and TP3.
