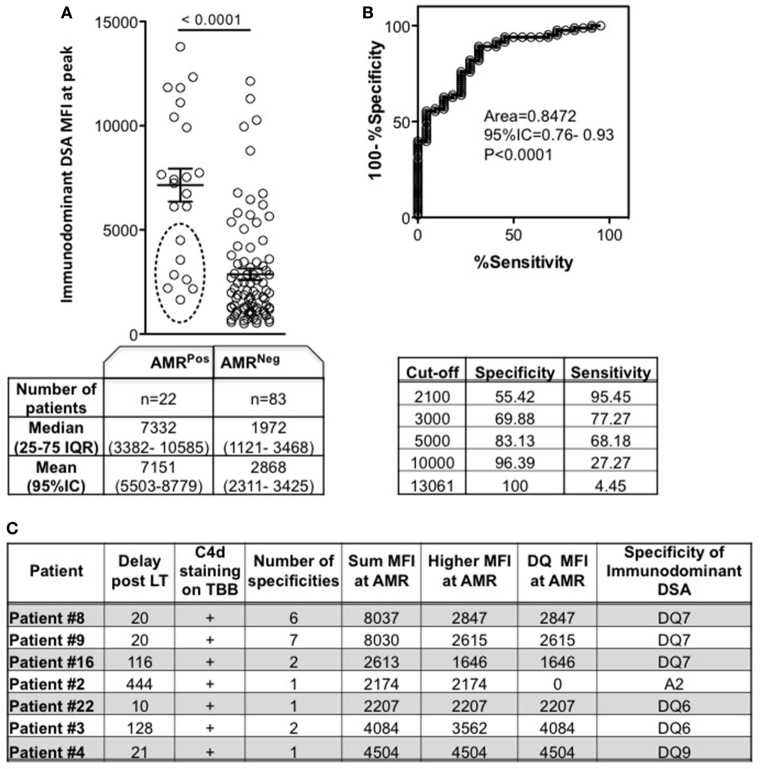
Figure 2.
Mean fluorescence intensity (MFI) of immunodominant donor-specific antibody (DSA) at peak according to antibody-mediated rejection (AMR) status. Peak was defined as the time point of DSA with the highest sum MFI for AMRNeg (DSAPosAMRNeg) patients, or as the time of AMR diagnosis for AMRPos patients. (A) Each patient’s immunodominant DSA is a circle. Circles inside broken line ellipse (n = 7) represent patients with AMR despite an immunodominant DSA MFI < 5,000, whose characteristics are detailed in panel (C) (Mann–Whitney test). (B) ROC curve for use of immunodominant DSA MFI as a predictor of AMR diagnosis, and the specificity/sensitivity according to different MFI cut-offs. (C) Characteristics of the 7 AMRPos patients with immunodominant DSA MFI < 5,000. Significance values are denoted above lines over compared groups.

