
Figure 3.
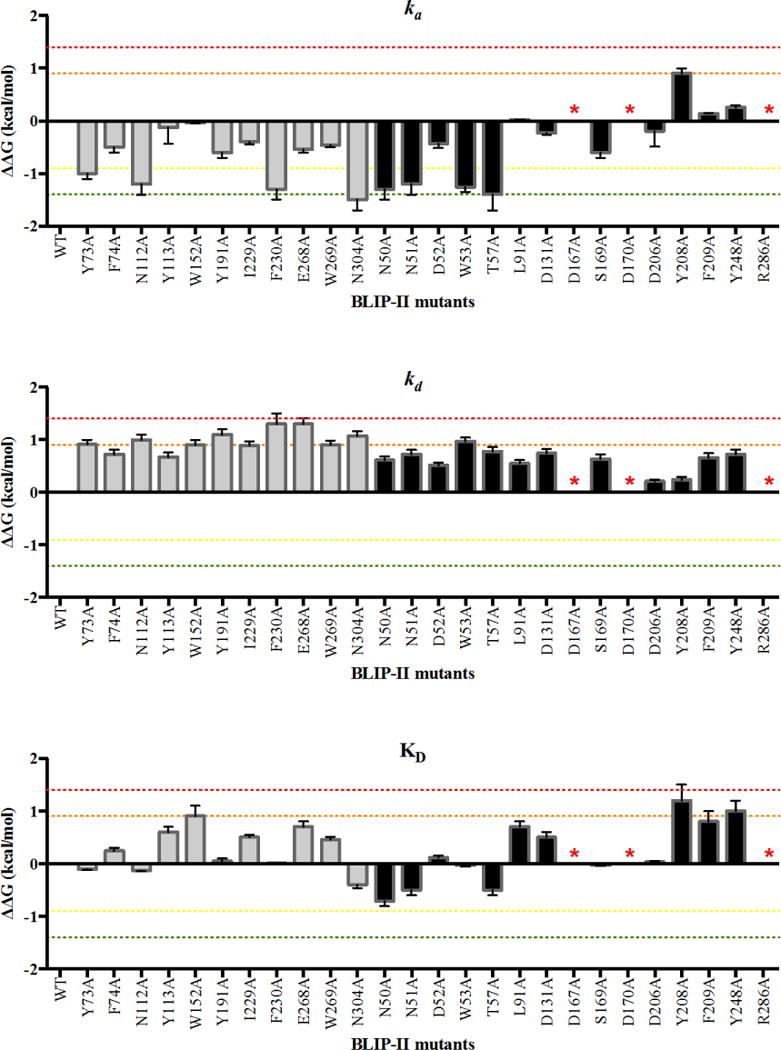
ka, kd, and KD ΔΔG values for BLIP-II alanine mutants. The ΔΔG value is depicted as a bar for each BLIP-II alanine mutant. The residues on the periphery of BLIP-II are shown as black bars while the inner ring of BLIP-II residues are shown as gray bars. Residues that reduced binding affinity to unmeasurable values when mutated to alanine are labeled with a red asterisk. The red dotted line marks a ΔΔG value of 1.4 kcal mol−1. The orange dotted line marks a ΔΔG of 0.9 kcal mol−1. The green dotted line marks a ΔΔG of −1.4 kcal mol−1. The yellow dotted line marks a ΔΔG of −0.9 kcal mol−1.