
Figure 5.
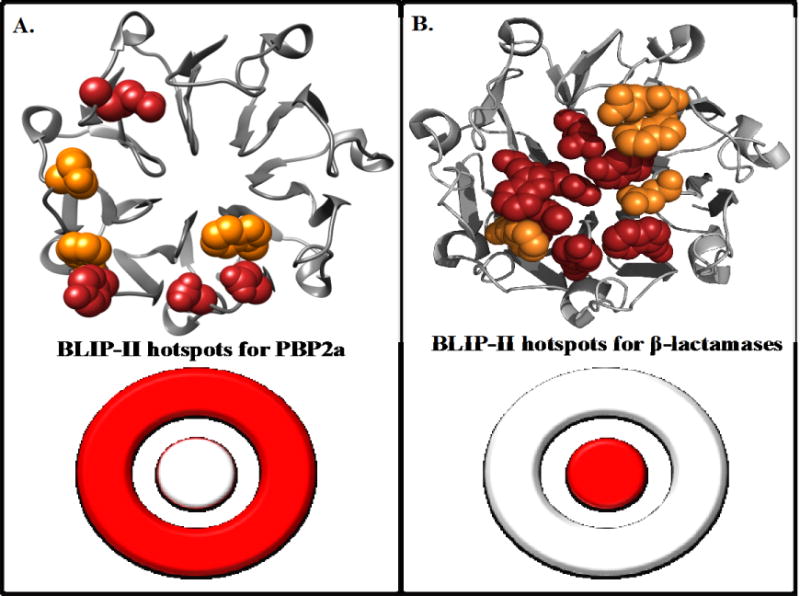
BLIP-II hotspot residues for binding PBP2a (A) and class A β-lactamases (B). BLIP-II is shown in grey ribbon with hotspot residues shown as spheres. Red residues indicate a greater than 10-fold decrease in binding upon mutation to alanine and orange indicates at least a 5-fold decrease in binding upon mutation. The hotspot residues for the class A β-lactamases (B) are hotspots for all class A β-lactamases tested in Brown et. al.(13). A bullseye representation of BLIP-II binding hotspots is shown on the bottom half of the figure.