Fig. 4.
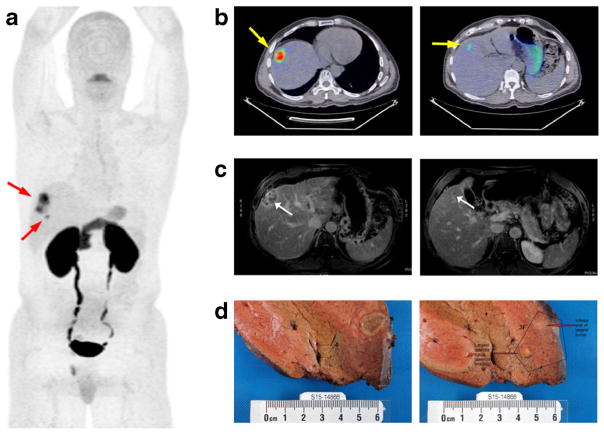
[18F]FSPG PET images from a 62-year-old male diagnosed with HCC (patient 5). a 2D coronal maximum intensity projection (MIP) of skull to mid-thigh [18F]FSPG PET scan showing two discrete areas of focal [18F]FSPG avidity (arrows). b Axial [18F]FSPG PET/CT fusion images corresponding to the two regions of uptake; PET images scaled to SUV 0–10 for comparison. c Delayed phase contrast-enhanced MRI of the main lesion (left) and satellite lesion (right). d Explanted pathological sections showing main lesion (left) and satellite lesion (right).

