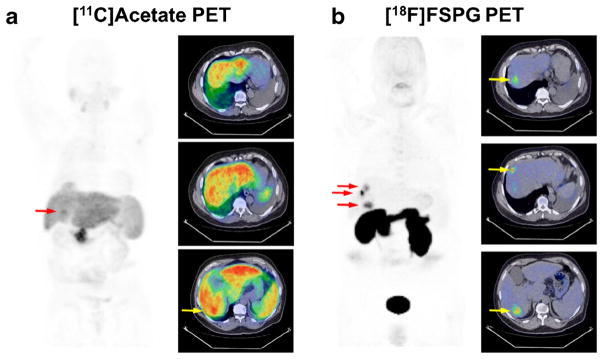
Fig. 6.
[11C]acetate PET and [18F]FSPG PET images from a 62-year-old male diagnosed with HCC (patient 10). Panels a and b show 2D coronal maximum intensity projections and axial PET/CT fusion images (insets); PET images scaled to SUV 0–10 for comparison. Approximately 20 min following [11C]acetate (7.7 MBq/kg/IV), diffuse uptake and poor lesion contrast were observed. Conversely, 60 min following [18F]FSPG PET (2.8 MBq/kg/IV), uptake was appreciably more focal and allowed clear delineation of three discrete areas of uptake within liver tissue (arrows).

