
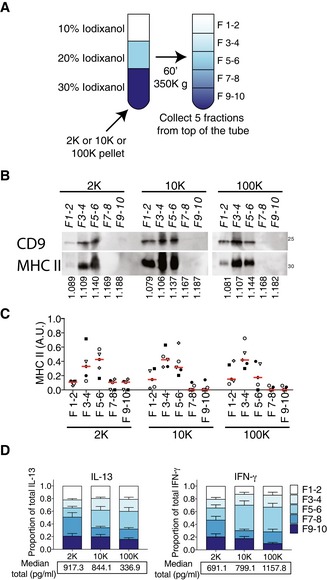
Figure 4. Analysis of EV function after floatation on iodixanol gradient.
-
A–CPellets obtained after 2K, 10K and 100K centrifugations from 80–120 × 106 cells were floated into an overlayed iodixanol gradient (A). Five fractions were collected and analysed by WB (representative of five experiments) (B), showing the floatation of MHC II‐ and CD9‐enriched EVs in fraction F3–4 and fraction F5–6. Densities of recovered fractions, as measured by refractometry, are shown below the WB figure (mean density of five independent gradients). Quantification of the distribution of MHC II relative abundance in all fractions of each centrifugation pellet analysed by WB of five independent experiments (C). For each pellet, arbitrary units (AU) = (SIfraction)/sum(SIF1–2 + SIF3–4 + SIF5–6 + SIF7–8 + SIF9–10) where SI = signal intensity (i.e. ratio of signal intensity in the given pellet to the total secreted protein) (n = 5, one symbol per donor). Red line indicates median.
-
DIL‐13 and IFN‐γ secretion was measured in supernatants after 6 days of total CD4+ T‐cell culture with the different fractions of the iodixanol gradients of the 2K, 10K and 100K pellets. The graph indicates the relative contribution of each fraction to the total cytokine secretion induced by each pellet. The relative contribution for each donor was calculated as CCfraction/sum(CCF1–2 + CCF3–4 + CCF5–6 + CCF7–8 + CCF9–10) for each pellet, where CC is cytokine concentration. Mean + SEM is shown. Below each graph, the sum of the cytokine concentration in all the fractions for each pellet is shown (median of 14 individual DC‐EV:T‐cell combinations).
Source data are available online for this figure.