
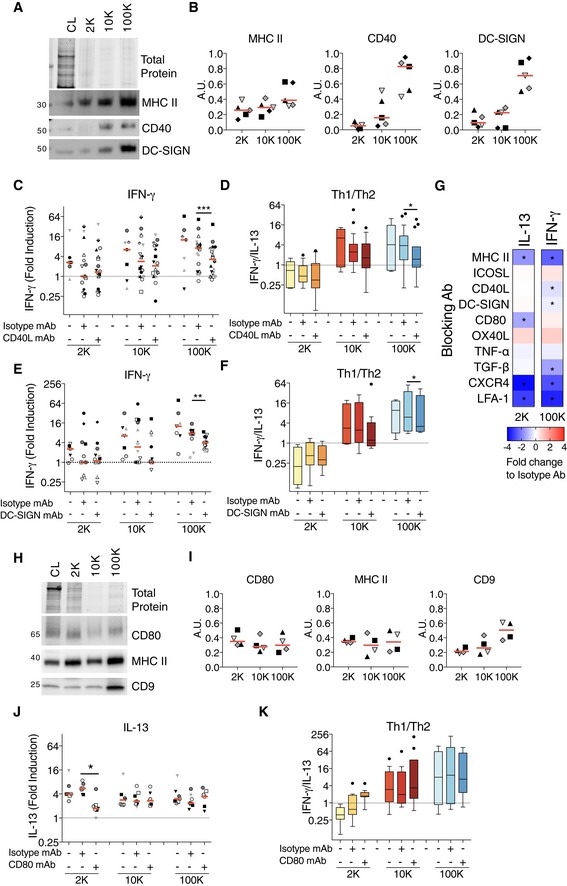
Figure 6. Blockade of CD40–CD40L interaction or of DC‐SIGN decreases the response induced by sEVs, whereas blockade of CD80 decreases the response induced by lEVs.
-
A, BThe successive pellets (2K, 10K, 100K) of EVs isolated from DCs were analysed by WB side‐by‐side with the lysate of producing cells (CL, 0.4 × 10⁶ cells), using antibodies to MHC II, CD40 and DC‐SIGN. Equivalent volume of each pellet was loaded on the gels (10 × 106 of secreting cells). Representative images (A) and quantifications (B) are shown (n = 5 donors, one symbol per donor). Red line indicates median.
-
C, DDC‐derived EVs (from 8 × 10⁶ secreting cells) were cultured for 6 days with total CD4+ T cells pre‐incubated with blocking antibodies against CD40L. IFN‐γ secretion for the cells stimulated with the different pellets is shown (C). Th1 to Th2 ratio was calculated by dividing the concentration of IFN‐γ to the concentration of IL‐13 for each DC‐EV:T‐cell donor combination (D) (n = 7–18). The range of cytokines secreted by untreated CD4+ T cells was 20.3–483.1 pg/ml of IL‐13; 30–319.2 pg/ml of IFN‐γ.
-
E, FDC‐derived EVs (from 8 × 10⁶ secreting cells) were pre‐incubated with blocking antibodies against DC‐SIGN for 30 min and then cultured with total CD4+ T cells for 6 days. Secretion of IFN‐γ for CD4+ T cells at the end of the culture with the 2K, 10K and 100K pellets is shown (E). Th1 to Th2 ratio was calculated as previously described for each DC‐EV: T‐cell donor combination (F) (n = 7–14). The range of cytokines secreted by untreated CD4+ T cells was 18–31 pg/ml of IL‐13; 21.5–194.8 pg/ml of IFN‐γ.
-
GMini‐screen using blocking antibodies against several molecules known to be relevant for DC:T‐cell interaction or to T‐cell activation by DCs (MHC II, ICOSL, CD40L, DC‐SIGN, CD80, OX40L, TNF‐α, TGF‐β, CXCR4, LFA‐1). DC‐derived 2K and 100K pellets (from 2 × 10⁶ secreting cells) were pre‐incubated with the indicated blocking antibodies or its corresponding isotype control for 30 min before the addition of the CD4+ T cells. In some cases, CD4+ T cells were incubated with the blocking antibodies prior the addition of the DC‐derived EVs (see Materials and Methods for details). The CD4+ T cells were cultured for 6 days, and the IL‐13 and IFN‐γ were measured in the culture supernatants. Heat map representing the median of the log2‐transformed fold change respect to each isotype control is shown (n = 4–6 individual DC‐EV:T‐cell combinations). Asterisks indicate significant difference of the blocking antibody with respect to the isotype antibody treatment.
-
H, IThe successive pellets (2K, 10K, 100K) of EVs isolated from DCs were analysed by WB side‐by‐side with the lysate of producing cells (CL, 0.4 × 10⁶ cells), using antibodies to MHC II, CD80 and CD9. Equivalent volume of each pellet was loaded on the gels (10 × 106 of secreting cells). Representative images (H) and quantifications (I) are shown (n = 4, one symbol per donor). Red line indicates median.
-
J, KDC‐derived EVs (from 2 × 10⁶ of secreting cells) were pre‐incubated with blocking antibodies against CD80 for 30 min and then cultured with total CD4+ T cells for 6 days. Secretion of IL‐13 at the end of the culture with the 2K, 10K and 100K pellets is shown (J). Th1 to Th2 ratio was calculated as already described for each donor (K) (n = 7). The range of cytokines secreted by untreated CD4+ T cells was 200.3–730.5 pg/ml of IL‐13; 18–151.3 pg/ml of IFN‐γ.