
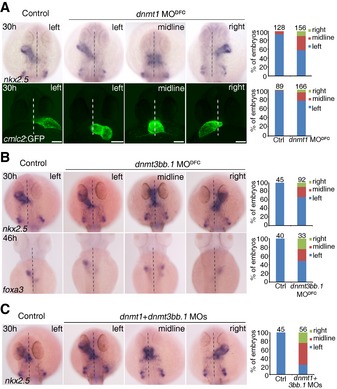
Figure 2. Defects in LR determination in Dnmt morphants.
-
A–CRepresentative images showing nkx2.5 expression in the heart at 30 hpf, foxa3 expression in visceral organs at 46 hpf or heart looping at 30 hpf using Tg(cmlc2: GFP) embryos (bottom panel) in control and DFC‐specific‐deficient embryos. Statistical analysis is shown on the right with the total observed number of embryos indicated above each bar. Effects of DFC‐specific dnmt1 (A), dnmt3bb.1 (B), and dnmt1 + dnmt3bb.1 (C) knockdown on organ laterality. Scale bar, 100 μm. Dashed lines denote the embryonic midline.