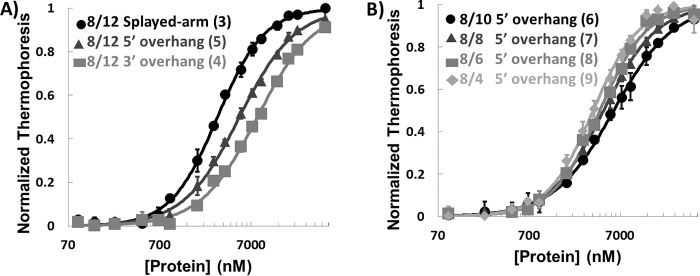
Figure 2.
XPA binding to ss-ds junction DNA substrates. A, plot of MST data for XPA DBD binding 8/12 HP splayed arm (circle), 8/12 5′ HP overhang (triangle), and 8/12 3′ HP overhang (square) (substrates 3, 5, and 4 in Fig. 1, respectively). B, plot of MST data for XPA DBD binding DNA substrates with 8-nt duplex and different lengths of 5′ overhangs (substrates 6–9 in Fig. 1). All measurements were made at room temperature in a buffer containing 50 mm Tris-HCl, pH 7.8, 150 mm NaCl, 10 mm MgCl2, 0.05% Tween 20, and 1 mm DTT. The error bars indicate standard deviations from at least three measurements.

