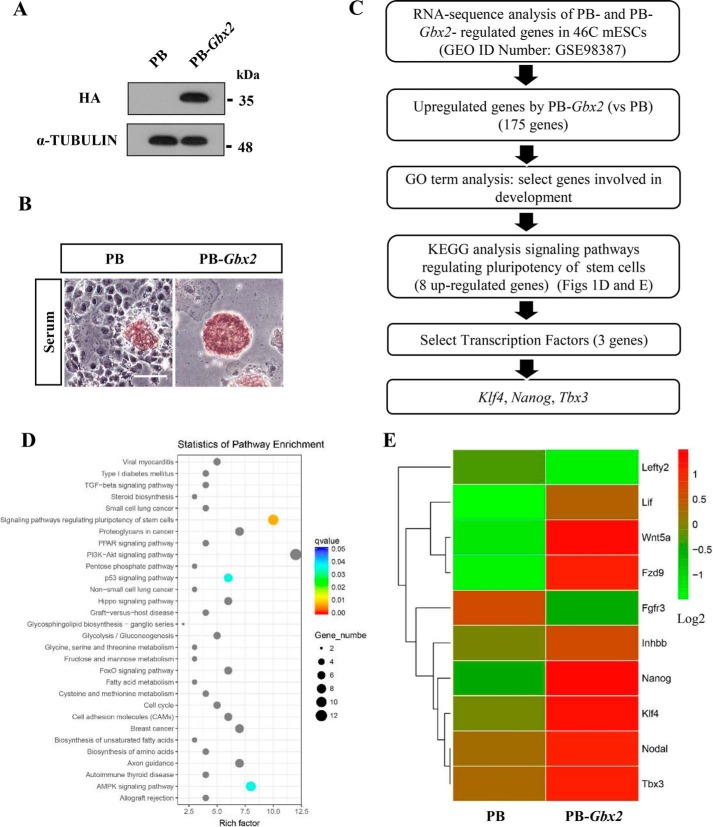
Figure 1.
RNA-sequence analysis of the genes up-regulated by Gbx2 in 46C mESCs. A, HA-tagged Gbx2 was introduced into 46C mESCs, and the protein level of HA-tagged Gbx2 was determined by Western blot. α-Tubulin is used as a loading control. B, AP staining of 46C mESCs overexpressing Gbx2 cultured in the absence of LIF for 8 days. Bar, 100 μm. C, flow chart illustrating the approach used to identify the candidate genes regulated by Gbx2 in 46C mESCs. Cells were maintained in serum medium supplemented with LIF. D, the Kyoto Encyclopedia of Genes and Genomes analysis of signal pathways classified and enriched by Gbx2-induced genes. The data are presented in a scatter diagram. E, heat map showed the expression pattern of the indicated genes in PB and PB-Gbx2 mESCs cultured in serum/LIF condition. Genes were ranked according to the level of log2 fold change. Red, expression above average; green, below average.

