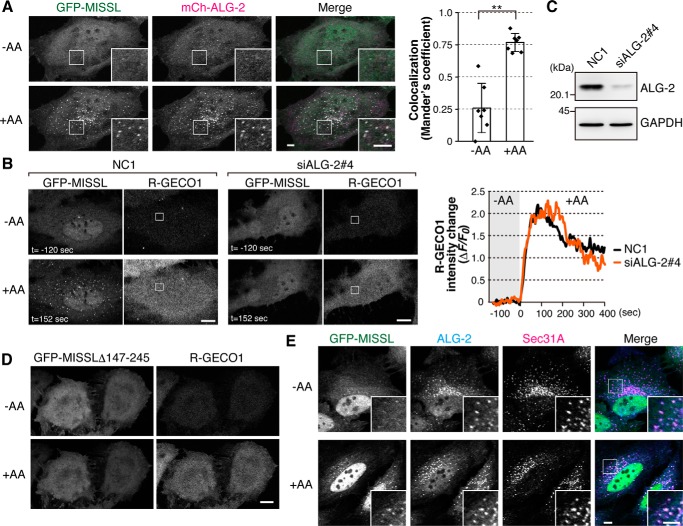
Figure 3.
MISSL is recruited to and colocalizes with ALG-2 at the ERES. A, GFP-MISSL puncta colocalize with mCh-ALG-2 puncta upon a calcium rise. HeLa cells transiently expressing both GFP-MISSL and mCherry-ALG-2 (mCh-ALG-2) were starved of amino acids for 50 min, and then an amino acid mixture was added. Representative time-lapse images of GFP-MISSL and mCh-ALG-2 before (−AA) and after (+AA) addition of the amino acid mixture are shown. Bars, 5 μm. Mander's correlation coefficient between GFP-MISSL and mCh-ALG-2 before (−AA) and after (+AA) addition of amino acid mixture was graphed as mean ± S.D. (n = 7). **, p < 0.01, two-tailed t test. B, knockdown of ALG-2 resulted in failure of the formation of GFP-MISSL puncta upon a calcium rise. HeLa cells that had been transfected with siRNA for a control (NC1) or ALG-2 (siALG-2#4) were transiently transfected with plasmids expressing GFP-MISSL and R-GECO1. The cells were starved of amino acids for 50 min, and then an amino acid mixture was added at t = 0. Time-lapse images of GFP-MISSL and R-GECO1 before (−AA, t = −120 s) and after (+AA, t = 152 s) are shown. Changes of fluorescent intensities of R-GECO1 at the region shown in the R-GECO1 images during the experiment are plotted. Bars, 10 μm. C, HeLa cells were transfected with siRNA for a control (NC1) and ALG-2 (siALG-2#4), and the cell lysates were analyzed by immunoblotting with the indicated antibodies. D, HeLa cells transiently expressing both GFP-MISSLΔ147–245 and R-GECO1 were starved of amino acids for 50 min, and then an amino acid mixture was added. Representative images of GFP-MISSLΔ147–245 and R-GECO1 before (−AA) and after (+AA) addition of the amino acid mixture are shown. Bar, 10 μm. E, GFP-MISSL puncta colocalize with Sec31A and ALG-2. HeLa cells transiently expressing GFP-MISSL were starved of amino acids for 50 min (−AA), and then an amino acid mixture was added for 10 min (+AA). Cells were fixed with 4% paraformaldehyde for 15 min and permeabilized with 0.1% Triton X-100 for 5 min. ALG-2 and Sec31A were immunostained with anti-ALG-2 and anti-Sec31A antibodies, respectively, and fluorescence signals were obtained by confocal microscopy. Merged images of GFP-MISSL (green), ALG-2 (cyan), and Sec31A (magenta) are also shown (Merge). Insets show magnified images of the region indicated by white squares. Bars, 5 μm.

