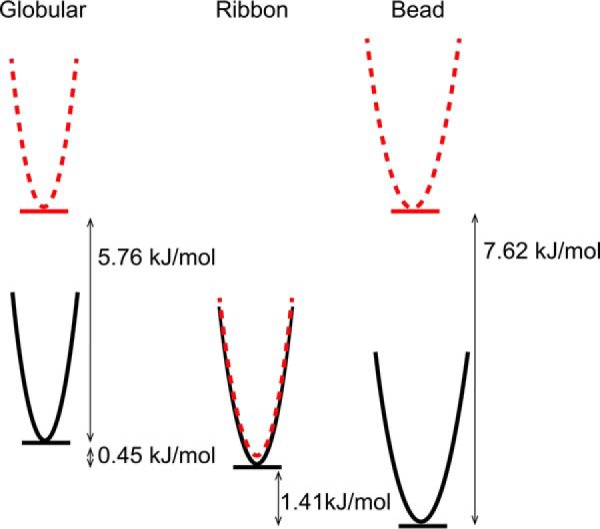
Figure 8.

Schematic representation of the relative energy of the three linear isomers of GeXIVA (black lines) and their cGeXIVA_GG (dotted red lines) analogs. The energy difference between isomers of the same peptide was computed using a Boltzmann distribution of the isomers at equilibrium.
