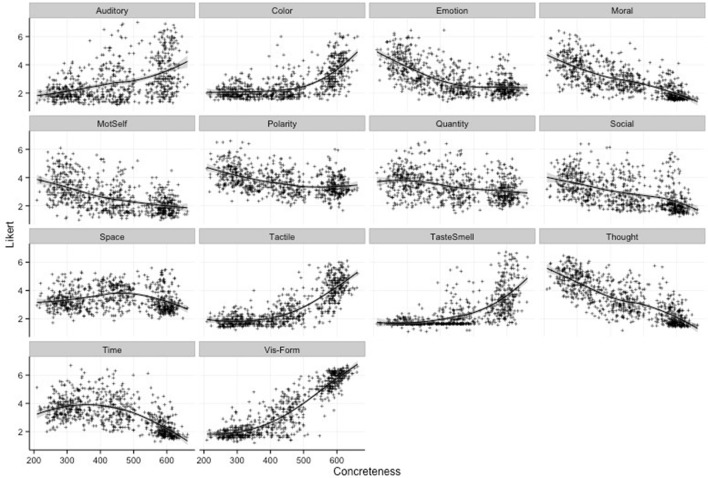
Figure 1.
Scatterplots of word concreteness by dimension with fit line included. The x-axis represents the concreteness of the concept while the y-axis represents the mean likert score of each concept for each domain. Curves were fitted using the Loess Method as implemented within the R statistical base package. Mot-Self, Self-Generated Motion; Social, Social Interaction; Vis-Form, Visual Form.

