
Figure 6.
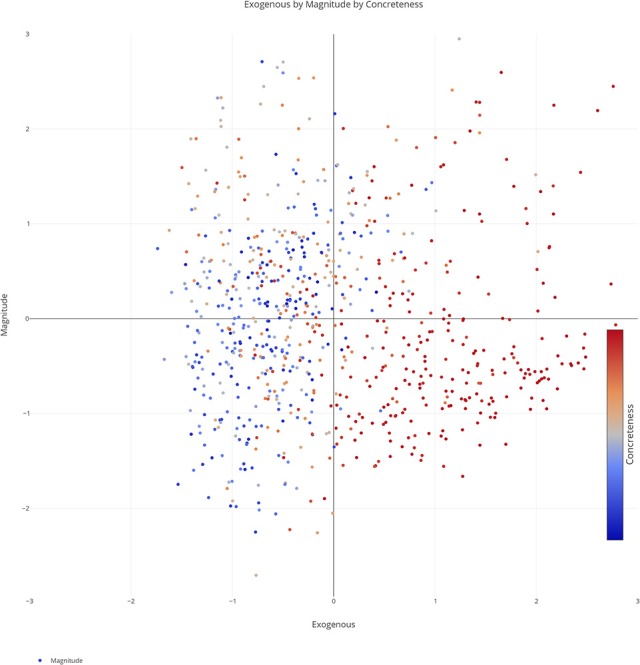
Two-dimensional scatterplot of semantic space with the color of the dots representing concreteness. Redder colors represent more concrete concepts while bluer colors represent more abstract concepts. The x, y-axis represent the exogenous & magnitude scores respectively of each concept.