
Figure 8.
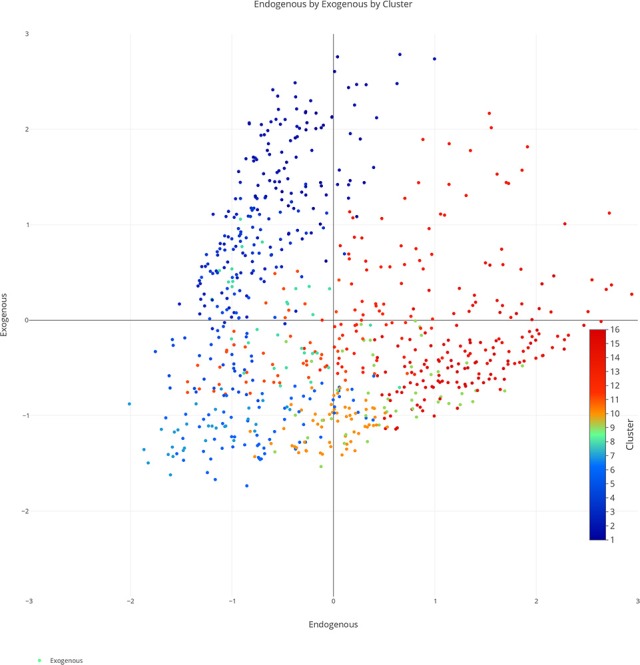
Two-dimensional semantic space with the color of the dots representing cluster membership. Each individual color represents a separate cluster from the cluster analysis. The x, y-axis represent the endogenous & exogenous scores respectively of each concept.