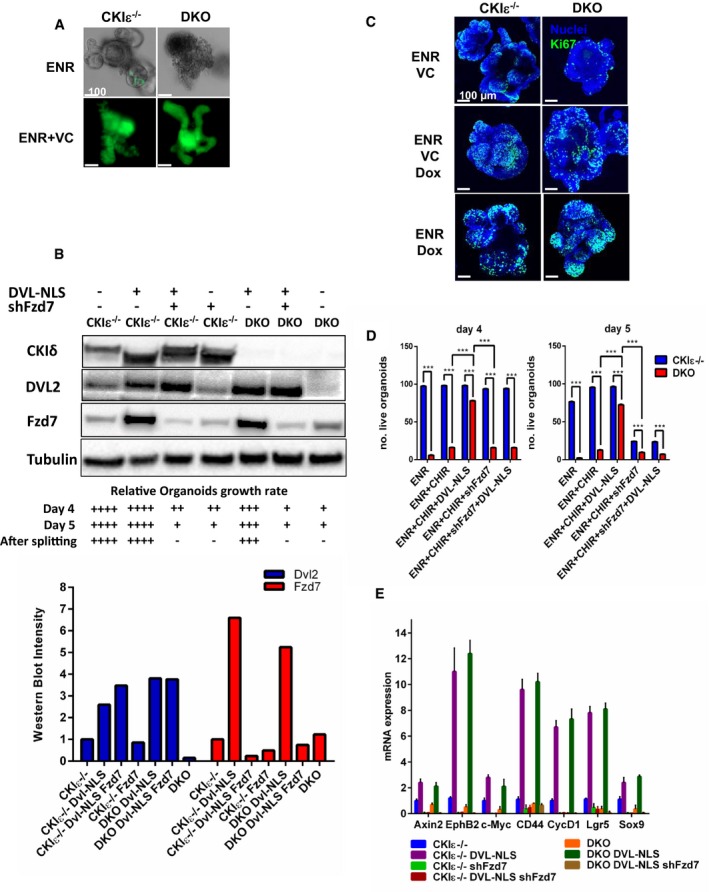
IF of GFP, marking Lgr5‐GFP+ cells in CKIε−/−‐VillinCreER‐Lgr5CreER (CKIε−/−) and DKO‐VillinCreER‐Lgr5CreER (DKO) organoids treated with regular medium (ENR) or with valproic acid (2 mM) and CHIR99021 (3 μM) added to ENR medium (ENR+VC), 5 days after KO induction. Scale bar, 100 μm.
WB analysis of CKIε−/− and DKO organoids infected with Dvl‐NLS and shFzd7 treated with ENR or ENR+Doxycycline 4 days after KO induction. The graph shows relative densitometry quantification of Western blot bands using ImageJ software. Relative growth rate of organoids following the different treatments after KO induction (day 0) is indicated at the bottom.
IF analysis of Ki67 staining (green) in CKIε−/− and DKO organoids treated with ENR, ENR+VC, ENR+Doxycycline, and ENR+VC+Doxycycline medium, 5 days after KO induction; nuclear counterstain Hoechst. Scale bar, 100 μm.
Survival assessment of CKIε−/− and DKO organoids treated with ENR, ENR+CHIR, ENR+CHIR+Dvl‐NLS, ENR+CHIR+shFzd7, and ENR+CHIR+Dvl‐NLS+shFzd7 was done by scoring 100 organoids for each treatment on day 4 or 5 after tamoxifen treatment and KO induction. Data represent mean of five independent experiments; t‐test was performed, ***P < 0.001.
qRT–PCR analysis of Lgr5 and Wnt target genes in CKIε−/− and DKO organoids treated ENR, ENR+CHIR, ENR+CHIR+Dvl‐NLS, ENR+CHIR+shFzd7 and ENR+CHIR+Dvl‐NlLS+shFzd7 (n = 3, mean ± SEM), 4 days after KO induction.

