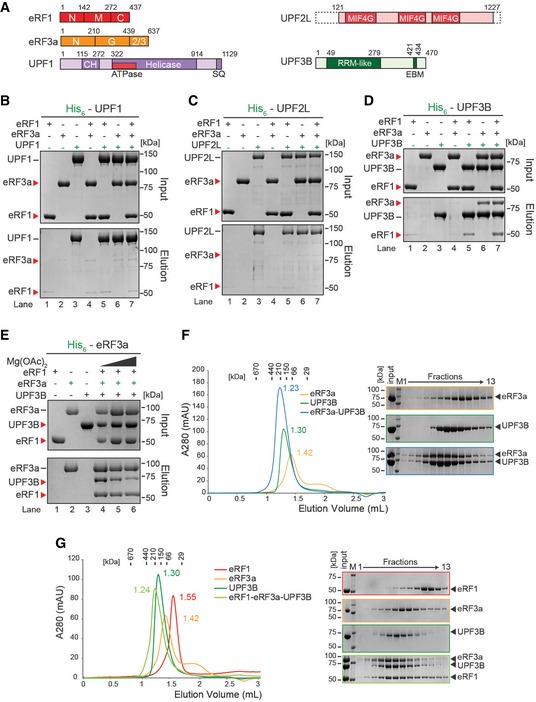
Schematic representation of eRFs, UPF1, UPF2L and UPF3B proteins. Domains of known function and structural motifs are indicated. N, M, C, G, CH stand for N‐terminal, middle, C‐terminal, GTP‐binding and cysteine–histidine‐rich domain, respectively. 2/3: domains 2 and 3. MIF4G: middle fragment of eIF4G, RRM: RNA recognition motif, EBM: EJC‐binding motif.
In vitro pulldown of eRF1 and/or eRF3a with His‐UPF1. Protein mixtures before loading onto the beads (input) or after elution (eluate) were separated by SDS–PAGE.
Pulldown as in (B), with His‐UPF2L as bait.
Pulldown as in (B), with His‐UPF3B as bait.
Pulldown of eRF1, UPF3B, or both with His‐eRF3a in buffer containing 0 (lane 4), 2.5 (lane 5) or 5 mM (lane 6) Mg2+.
Left: SEC elution profile of eRF3a (yellow), UPF3B (green), or both (blue). The elution volume (in ml) is indicated for each experiment. Column calibration was performed with globular proteins (shown above). Right: SDS–PAGE analysis of eluate fractions. M: protein molecular weight standards (kDa).
SEC elution profile and SDS–PAGE analysis as in (F) of eRF1 (red), eRF3a (orange), UPF3B (dark green) or all three (light green). See also Fig
EV3.
Data information: Panels (B, C) each represent three independent experiments. Panels (E–G) each represent two independent experiments. (B–D) Bands in lanes 1, 2 and 4 of the eluate panels represent background binding of the untagged eRFs to the Ni‐NTA resin.