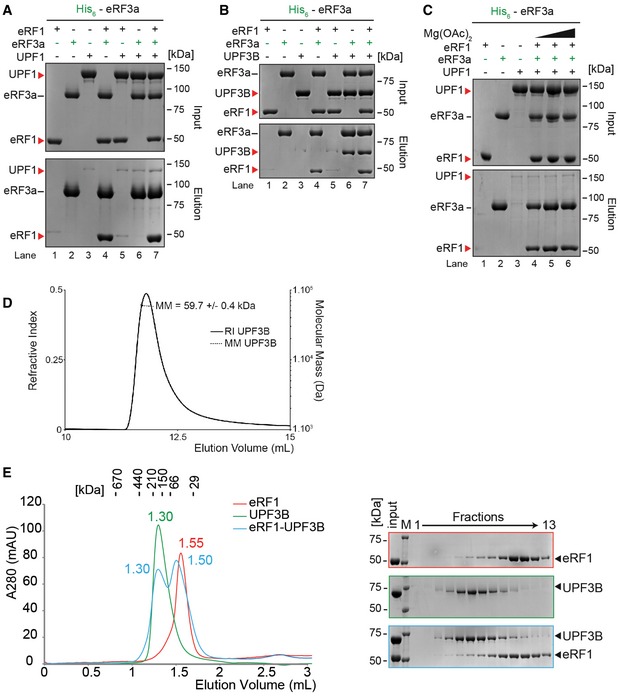
In vitro pulldown of eRF1 and/or UPF1 with His‐eRF3a. Protein mixtures before loading onto the beads (input) or after elution (eluate) were separated by SDS–PAGE.
Pull‐down experiment as in (A) with eRF1, UPF3B and His‐eRF3a.
Pull‐down experiment as in (B) with eRF1, UPF1 and His‐eRF3a in buffer containing 0, 2.5 or 5 mM Mg2+ (lanes 4, 5, or 6 respectively).
Molecular mass of UPF3B determined by size‐exclusion chromatography using a Superdex 200 column combined with detection by multiangle laser light scattering and refractometry (SEC‐MALLS‐RI). The SEC elution profiles as monitored by refractometry (RI) are represented for UPF3B. The molecular mass (MM) of UPF3B calculated from light scattering and refractometry data is indicated.
Left: SEC elution profile of eRF1 (red), UPF3B (green) or both (blue). The elution volume (in ml) is indicated for each experiment. Calibration of the column was performed with globular proteins (shown above). Right: SDS–PAGE analysis of eluate fractions. M: protein molecular weight standards (kDa).
Data information: Panels (A–C) each represent three independent experiments. Panels (D, E) each represent two independent experiments. (A–C) Bands in lanes 1, 3 and 5 of the eluate panels (A, B) and bands in lanes 1 and 3 of the eluate panel in (C) represent background binding of untagged proteins to the Ni‐NTA resin.
Source data are available online for this figure.