
Figure EV4. UPF1‐UPF3B complex formation is not prevented by RNA .
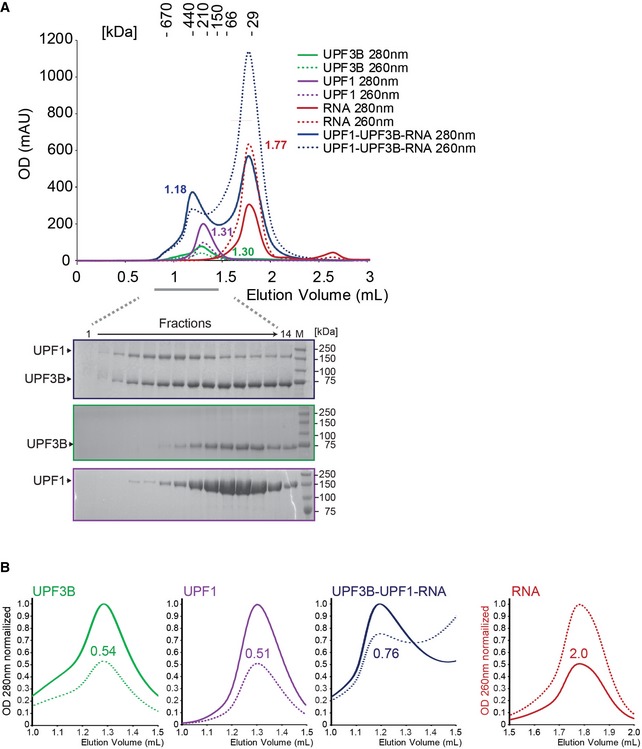
- SEC elution profile of UPF3B (green), UPF1 (purple), RNA (red) and a mix of UPF3B, UPF1 and a threefold excess of RNA (blue). Below: SDS–PAGE analysis of eluate fractions.
- Analysis of SEC peak fractions. Peaks representing UPF3B (green) and UPF1 (purple), elute with an OD 260 nm/280 nm ratio of 0.54 and 0.51, respectively, whereas the RNA oligomer (red) elutes with an OD 260 nm/280 nm ratio of 2.0. The peak containing the UPF3B‐UPF1 complex after incubation of UPF1, UPF3B and RNA (blue) has a higher OD 260 nm/280 nm ratio of 0.76 due to the presence of RNA in this peak.
Source data are available online for this figure.