
Figure 7. UPF3B dissociates post‐TCs.
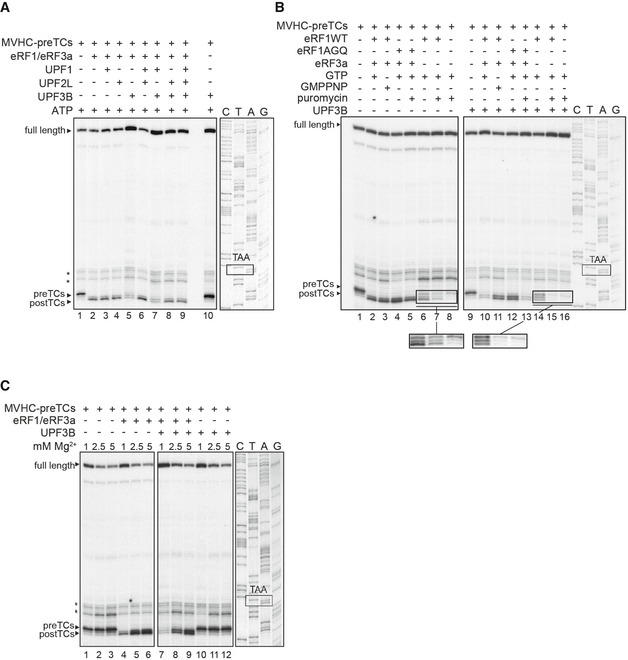
- Toeprinting analysis of ribosomal complexes obtained by incubating MVHC‐pre‐TCs with UPF1, UPF2L, UPF3B, or BSA at 1 mM free Mg2+ and 1 mM ATP followed by termination with saturating amounts of eRF1 and eRF3a. Asterisks mark initiation and elongation complexes.
- Toeprinting analysis of ribosomal complexes obtained by incubating pre‐TCs as in (A) with UPF3B or BSA and combinations of eRF1, eRF1AGQ, eRF3a and puromycin in the presence of GTP or GMPPNP. Pre‐/post‐TC profiles of lanes 6–8 and 11–14 are enlarged to allow a better assessment. The gel on the left was exposed 2× longer than gel on the right. Note that puromycin‐treated pre‐TCs are relatively unstable at the low Mg2+ concentrations used (Skabkin et al, 2013).
- Mg2+ sensitivity of post‐TC dissociation by UPF3B. Toeprinting analysis of ribosomal complexes obtained by incubating MVHC‐pre‐TCs with BSA (lanes 1–6) or UPF3B (lanes 7–12) and at the indicated concentrations of free Mg2+. Termination was completed by adding eRF1 and eRF3a to the samples in lanes 4–9. Lanes 1–6 were exposed 2× longer than lanes 7–12. Asterisks mark initiation and elongation complexes.