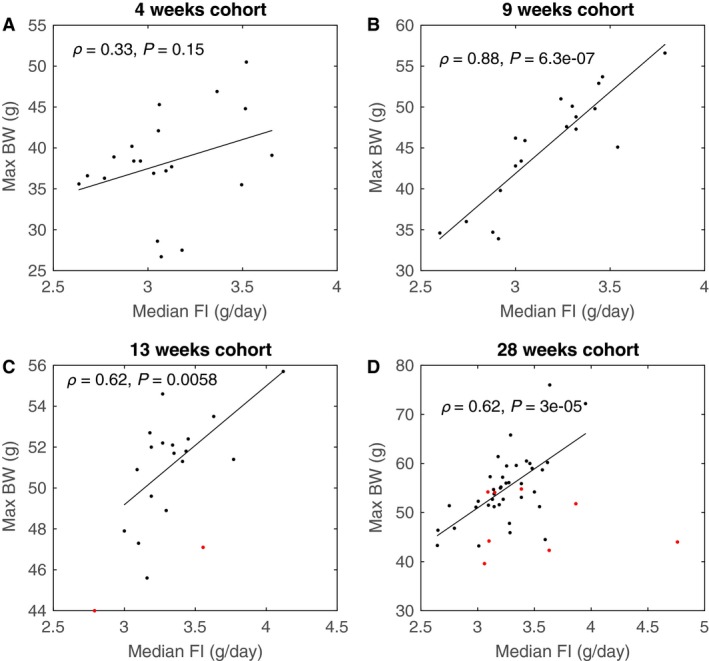
Figure 2.

Correlations between individual median food intake over time with the maximally attained body weight of the respective cohorts. Red points indicate animals that dropped out before the end of the experimental period. Pearson correlations shown are with dropouts excluded. When including dropouts correlations are ρ = 0.62 (P = 0.0037) and ρ = 0.24 (P = 0.10) for the 13 and 28 weeks cohort, respectively.
