
Figure 4.
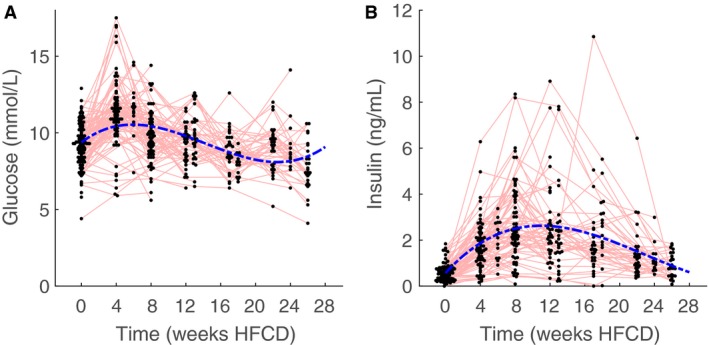
Whole blood glucose (A) and plasma insulin (B) of male apoE*3L.CETP mice as measured at the indicated time points. Data for the respective cohorts was pooled when measured on the same time point. Blue‐dotted lines represents the group mean response of the mixed model. Red lines connect measurements performed on the same individual animal. Note the biphasic response and that glucose peaks earlier than plasma insulin levels.