Figure 5.

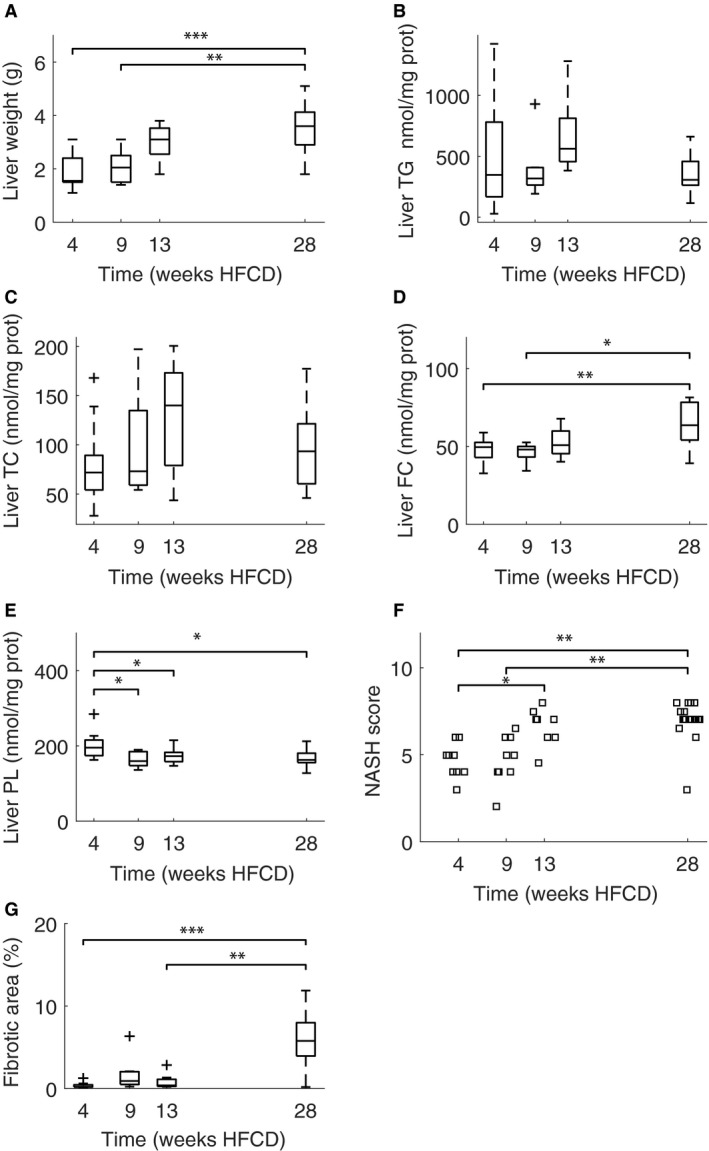
Liver weights (A), liver triglyceride (B), total cholesterol (C), free cholesterol (D) and phospholipid (E) concentrations, and NASH scores (F) and fibrotic area (G) of livers in male apoE*3L.CETP cohorts sacrificed after 4, 9, 13, and 28 weeks HFCD, respectively. NASH scores show a statistically significant difference both between 4 weeks and 13 (P = 0.047) and 28 weeks (P < 0.01) and between 9 weeks and 28 weeks (P < 0.01), using the one‐way Kruskal–Wallis test. Fibrotic area was remarkably similar for the cohorts sacrificed up to 13 weeks while fibrotic area after 28 weeks HFCD diet was notably increased (P < 0.01). N = 10, 10, 9 and 21 for 4, 9, 13, and 28 weeks HFCD diet, respectively. Significant differences are denoted with brackets and asterisks: P < 0.05 (*), P < 0.01 (**), P < 0.001 (***).
