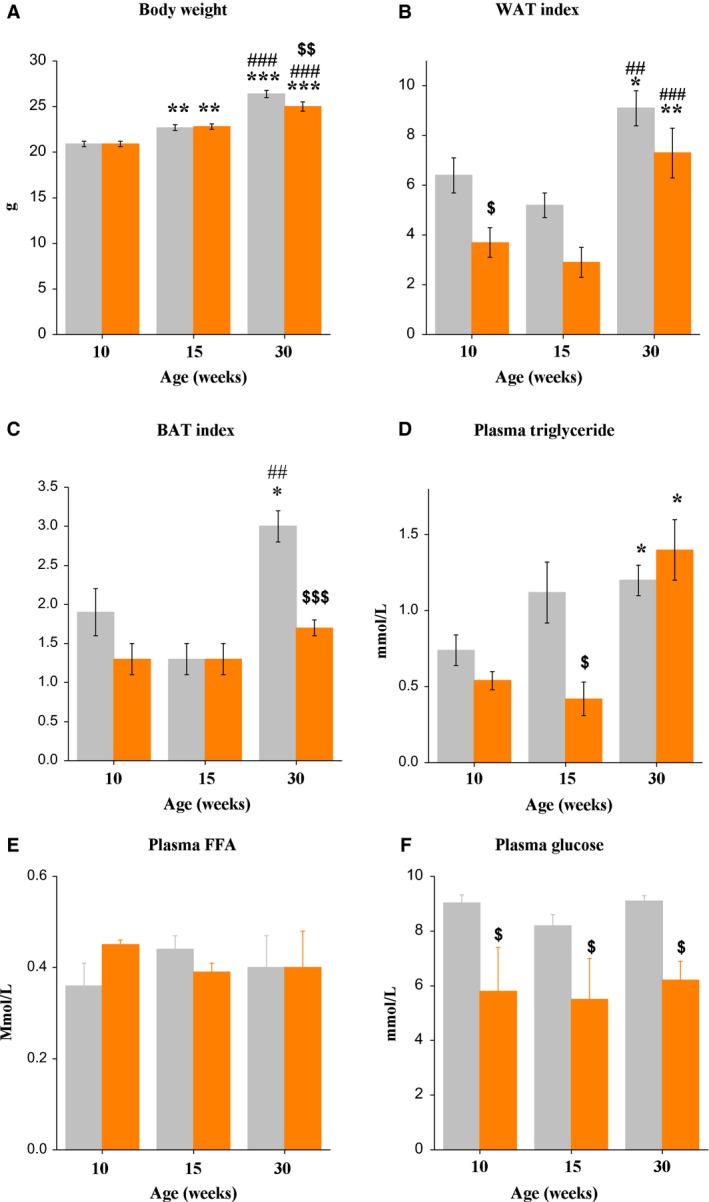
Figure 1.

(A) Body weight, (B) perigonadal WAT index, (C) BAT index, (D) plasma triglyceride, (E) free fatty acid, and (F) glucose concentrations in fed (gray bars) and 16 h‐fasted (orange bars) male C57Bl mice of three ages. Data are expressed as the means ± SEM. *P < 0.05, **P < 0.01, ***P < 0.001 versus 10‐week group under the same feeding condition; ## P < 0.01, ### P < 0.001 versus 15‐week group under the same feeding condition; $ P < 0.05, $$ P < 0.01, $$$ P < 0.001 versus fed mice within the same age group.
