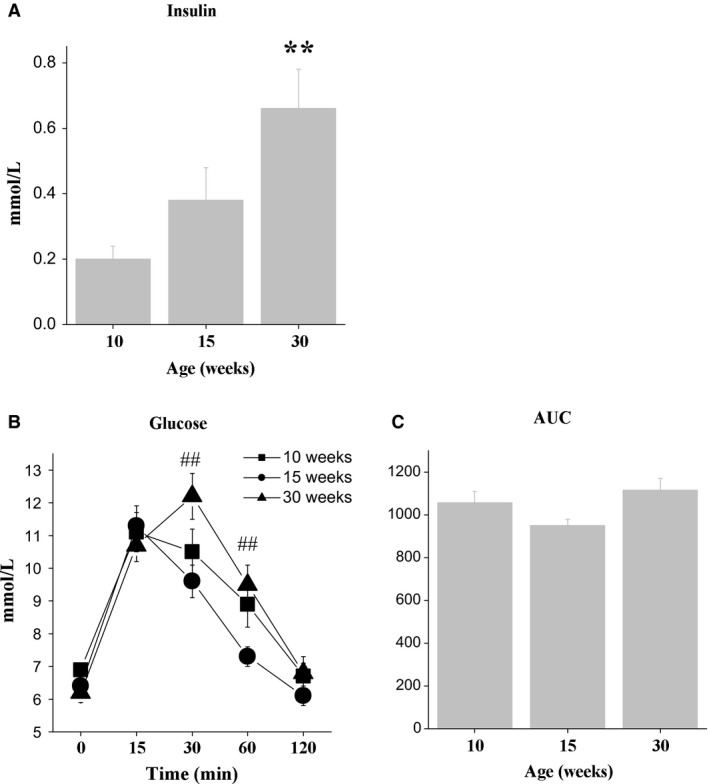
Figure 2.

(A) Plasma insulin, (B) blood glucose concentrations from the oral glucose tolerance test (OGTT), and (C) area under the curve (AUC) for glucose in 16 h‐fasted male C57Bl mice of three ages. Data are expressed as the means ± SEM. **P < 0.01 versus 10‐week group; # P < 0.05 versus 15‐week group.
