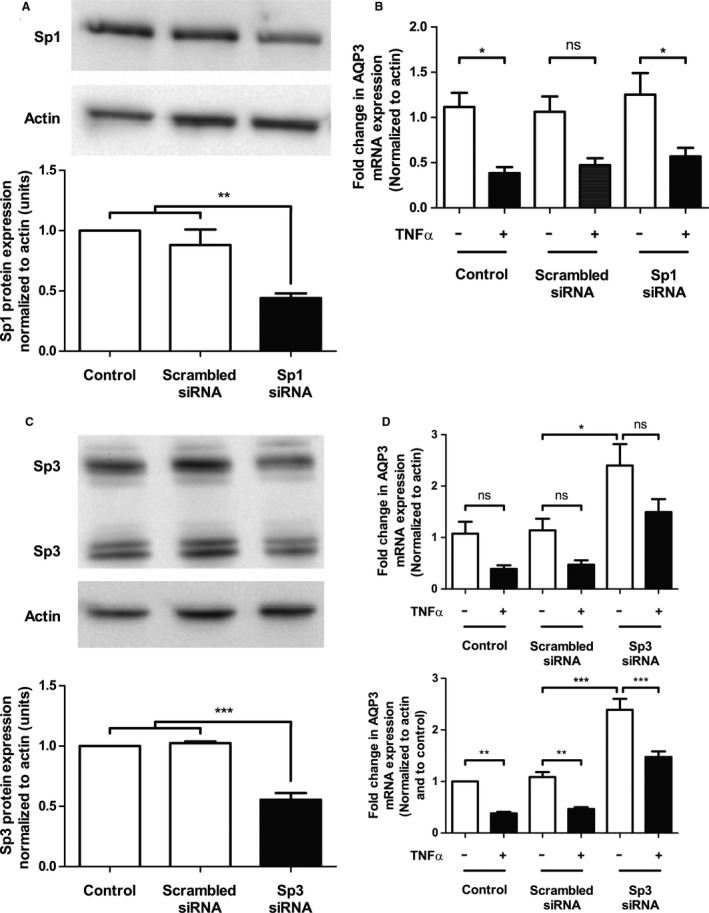
Figure 3.

Knockdown of Sp3 increases constitutive AQP3 mRNA expression and partially blocks the TNF α‐induced decrease in AQP3 expression, whereas Sp1 knockdown does not alter AQP3 expression dynamics. Sp1 (A) and Sp3 (C) protein expression was assessed by western blot at 72 h following transient transfection with either 300 nmol/L scrambled or Sp1/Sp3 siRNA. Control cells were left untransfected. A representative blot is shown above each graph. Densitometry was performed on western blots (lower graph) and a ratio of Sp1 or Sp3 to actin normalized to the untransfected control was plotted, with statistical significance assessed by ANOVA and a Tukey's post hoc test. (n = 4; **P < 0.01; ***P < 0.001). (D) HT‐29 cells were transfected with 300 nmol/L scrambled or Sp1 (B)/Sp3 siRNA, followed by treatment with TNF α (25 ng/mL) for 12 h and assessment of AQP3 mRNA expression by real‐time RT‐PCR normalized to actin (top panel), and normalized to control (bottom panel) to account for intra‐assay variation. Control HT‐29 cells were left untransfected and statistical significance was assessed by ANOVA and a Tukey's post hoc test (n = 6; *P < 0.05).
