
Figure 2.
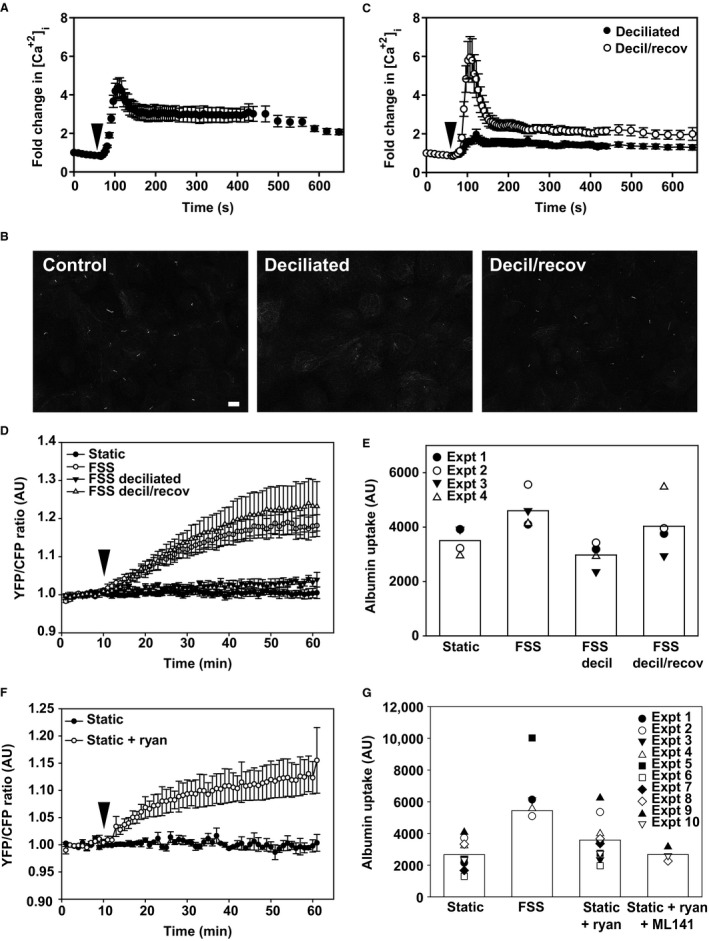
Primary cilia and calcium are required for the activation of Cdc42 by FSS. (A) OK cells cultured in Ibidi chambers were loaded with Fura‐2 and [Ca2+]i levels were monitored before and upon exposure to 0.1 dyne/cm2 FSS (arrowhead). (B) Indirect immunofluorescence of acetylated tubulin staining to visualize primary cilia in control cells, cells deciliated with ammonium sulfate (decil), and deciliated cells after overnight recovery to enable cilia regrowth (decil/recov). Scale bar: 10 μm. (C) [Ca2+]i levels were monitored as above in deciliated cells immediately after deciliation and after overnight recovery. Kruskal–Wallis test (nonparametric) followed by Dunn's multiple comparisons test confirmed statistically significant differences in peak [Ca2+]i levels between control and deciliated cells (P < 0.001) and between deciliated and recovered cells (P < 0.001). (D) Cdc42 is not activated in deciliated cells exposed to FSS. Cells were deciliated for 3 h prior to exposure to 0.1 dyne/cm2 FSS for 30 min starting at 10 min (arrowhead) or incubated overnight to recover cilia prior to measuring the Raichu‐Cdc42 FRET response to FSS. Mean ± SEM is plotted (static, n = 6; FSS, n = 7; deciliation, n = 8, decil/recov, n = 3). Profiles for FSS versus rescue and static versus deciliated conditions were not significantly different from each other; P values for all other comparisons were <0.001 by two‐way ANOVA. (E) Endocytosis is not stimulated by FSS in deciliated cells. OK cells cultured on Ibidi chambers were deciliated immediately prior to quantitation of AlexaFluor 647‐albumin uptake or incubated overnight to recover cilia. Data from four individual experiments, each shown using a different symbol, are plotted, and the bar shows the mean uptake for each condition. Representative images from a separate experiment in which cells were fixed and albumin uptake imaged using confocal microscopy are shown above each bar. Scale bar: 25 μm. (F) Ryanodine activates Cdc42 in the absence of FSS. FRET ratios were monitored in OK cells transfected with the Raichu‐Cdc42 under static conditions. Ryanodine (25 μmol/L) was added at 10 min (arrowhead) and the incubation continued for an additional 50 min. The mean of from three experiments is plotted. Profiles for static versus static + ryanodine are significantly different from each other (P < 0.001) by two‐way ANOVA. (G) Ryanodine‐stimulated albumin uptake in the absence of FSS is inhibited by ML‐141. Data from 10 experiments are plotted, and the bar shows the mean uptake for each condition.