
Figure 3.
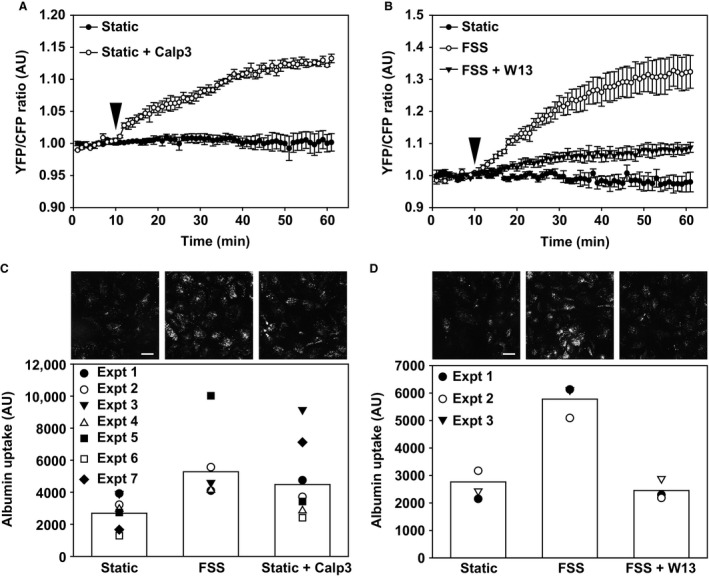
CaM activation is required for Cdc42 activation and FSS‐stimulated endocytosis. (A) FRET ratios were monitored in OK cells transfected with the Raichu‐Cdc42 under static conditions. The calmodulin activator Calp3 (5 μmol/L) was added at 10 min (arrowhead). The mean ± SEM of three independent experiments is plotted. Profiles for static versus static + Calp3 are significantly different from each other (P < 0.001) by two‐way ANOVA. (B) FRET measurements of OK cells transfected with the Raichu‐Cdc42‐ transfected OK cells were maintained under static conditions or exposed to 0.1 dyne/cm2 FSS for 30 min starting at 10 min (arrowhead). The calmodulin inhibitor W13 (60 μmol/L) was included where indicated. Data (mean ± SEM) from three independent experiments are plotted. Profiles for all conditions are significantly different from each other (P < 0.001) by two‐way ANOVA. (C) Calp3 increases albumin uptake under static conditions. Data from seven experiments are plotted, and the bar shows the mean uptake for each condition. Representative images from a separate experiment in which cells were fixed and albumin uptake imaged using confocal microscopy are shown above each bar. Scale bar: 25 μm. (D) W13 inhibits albumin uptake in response to FSS. Data from three experiments are plotted, and the bar shows the mean uptake for each condition. Representative images from a separate experiment in which cells were fixed and albumin uptake imaged using confocal microscopy are shown above each bar. Scale bar: 25 μm.