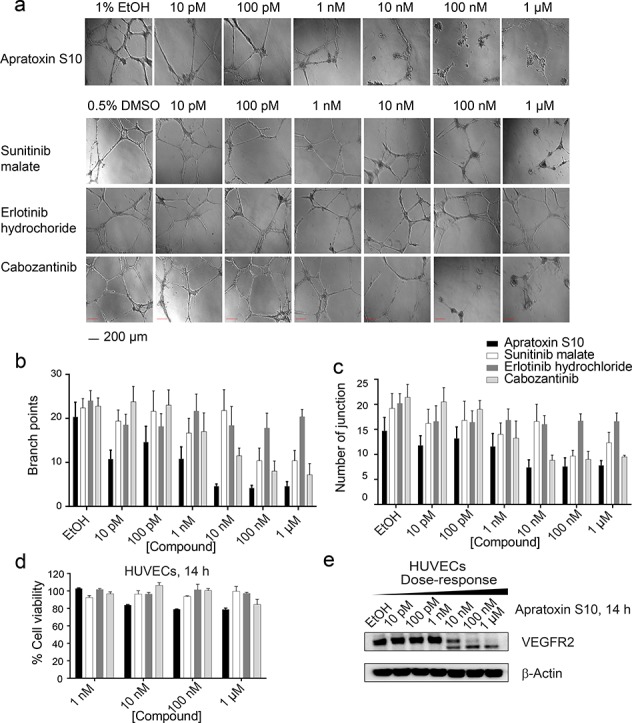
Figure 3.

(a) Apratoxin S10 inhibited angiogenesis in vitro in a dose-dependent manner, determined by matrigel assay using HUVECs (scale bar 200 μm), 14 h. Three known RTK inhibitors were tested in parallel. (b) Branch point counting was used as quantification method. Five random microscope view-fields were counted, and the number of branch points was averaged. (c) Number of junctions analyzed by the Angiogenesis Analyzer plug-in for ImageJ (n = 5 per group). Error bars in (c) and (d) indicate mean ± SEM of five fields. (d) Antiproliferative effect of apratoxin S10 and known RTK inhibitors on HUVECs. Error bars indicate mean ± SD of three replicates. (e) Immunoblot analysis using lysates from apratoxin S10-treated HUVECs, 14 h. The higher bands are functional (glycosylated) VEGFR2. The lower bands correspond to the unprocessed (non-glycosylated) form of VEGFR2.
