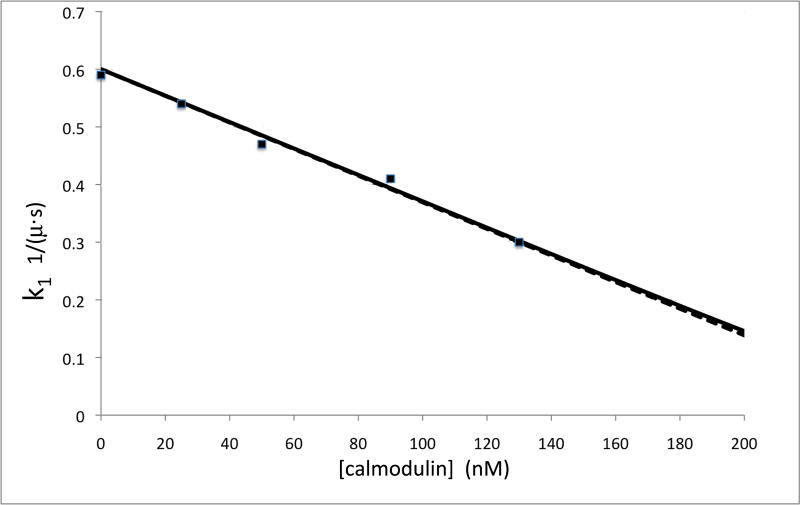
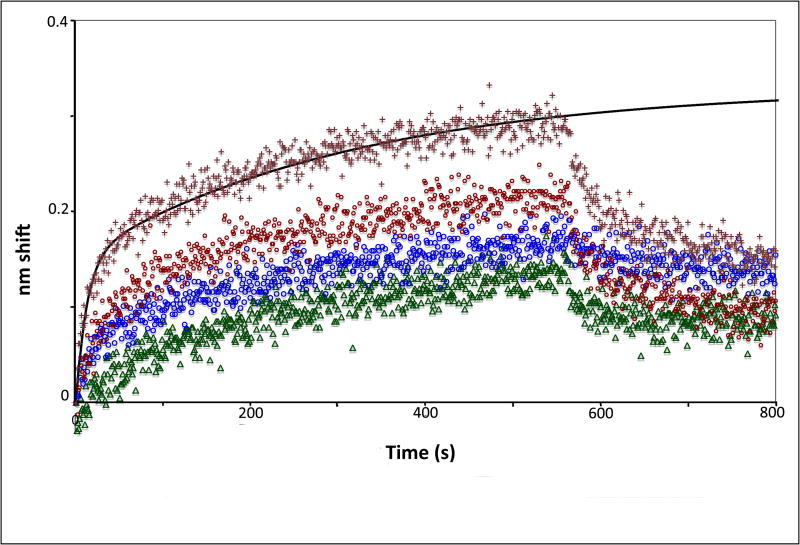
Figure 2. Competition and ligand-analyte reversal experiments.
(A) Competition experiment in which free CaM was added to eNOS before binding to determine the concentration of CaM binding sites. Plot shows k1 vs. [calmodulin]. (B) Sensorgrams of binding of analyte calmodulin to ligand eNOS holoenzyme. CaM concentrations top to bottom were 40 nM (crosses), 30 nM (red circles), 20 nM (blue circles), and 10 nM (green triangles).


