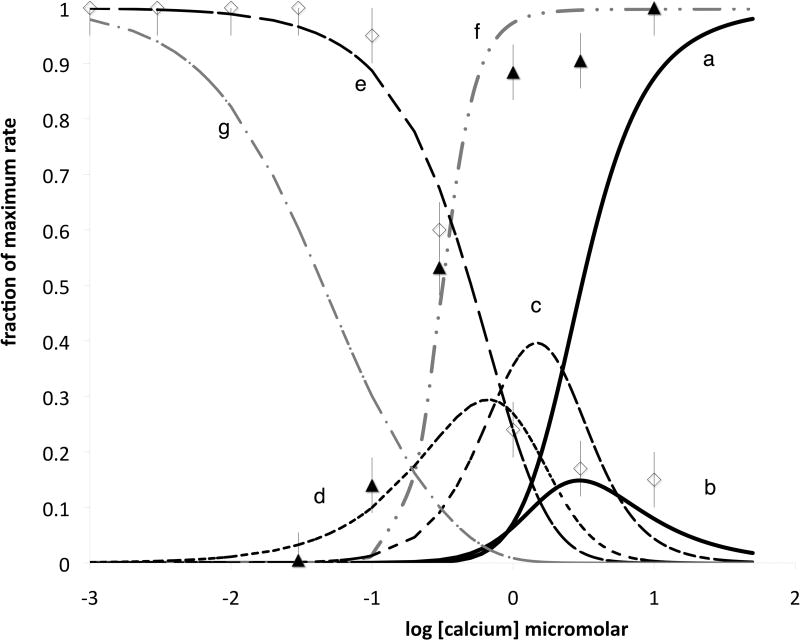
Figure 5. Ca2+ depedence of eNOS binding and dissociation.
Open diamonds represent dissociation rate constants estimated from binding phases; closed triangles are association rate constants, both as a fraction of maximum rate. The two solid black lines are fractional population for free CaM 4 Ca2+ (a) and free 3 Ca2+ (b) corresponding respectively to the right hand state in figure 4B and the four states second from the right. The next two transients in black moving left are the 2 (c) and 1 (d) Ca2+ states, and the empty state is the dashed black sigmoidal curve (e). The grey sigmoid (f) represents the calcium replete state in the presence of X (the unoccupied calmodulin target) at 104 its Kd in excess calcium; the sigmoidal curve on the far left (g) is the empty state (no Ca2+ or target) under the same conditions.

