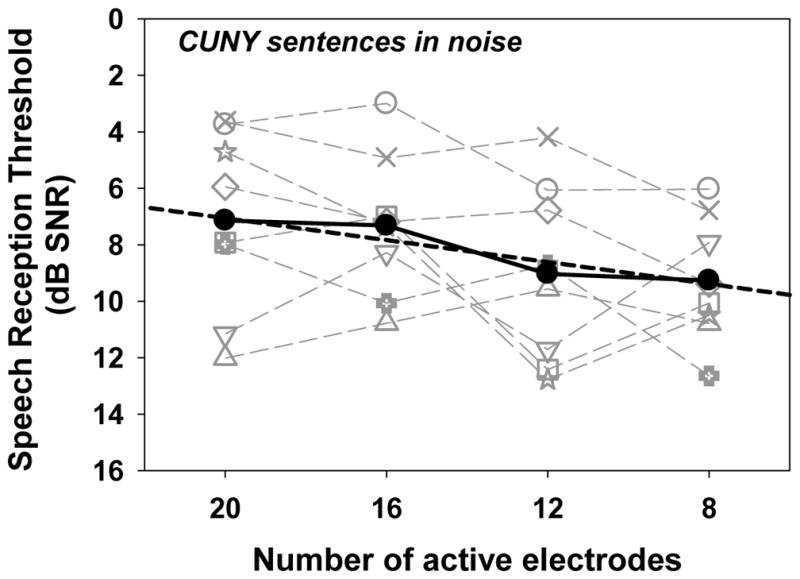
Figure 1.

Results for the CUNY sentence recognition in noise task. The number of active electrodes is shown along the x-axis, while the speech recognition threshold (SRT) in dB SNR is shown along the y-axis. Smaller SNR values indicate better performance: i.e. reception of sentence material at more challenging signal to noise ratios. The gray symbols and dashed lines indicate results for individual subjects, while the black filled circles and solid lines indicate average data across all subjects. The dashed black line represents the regression line.
