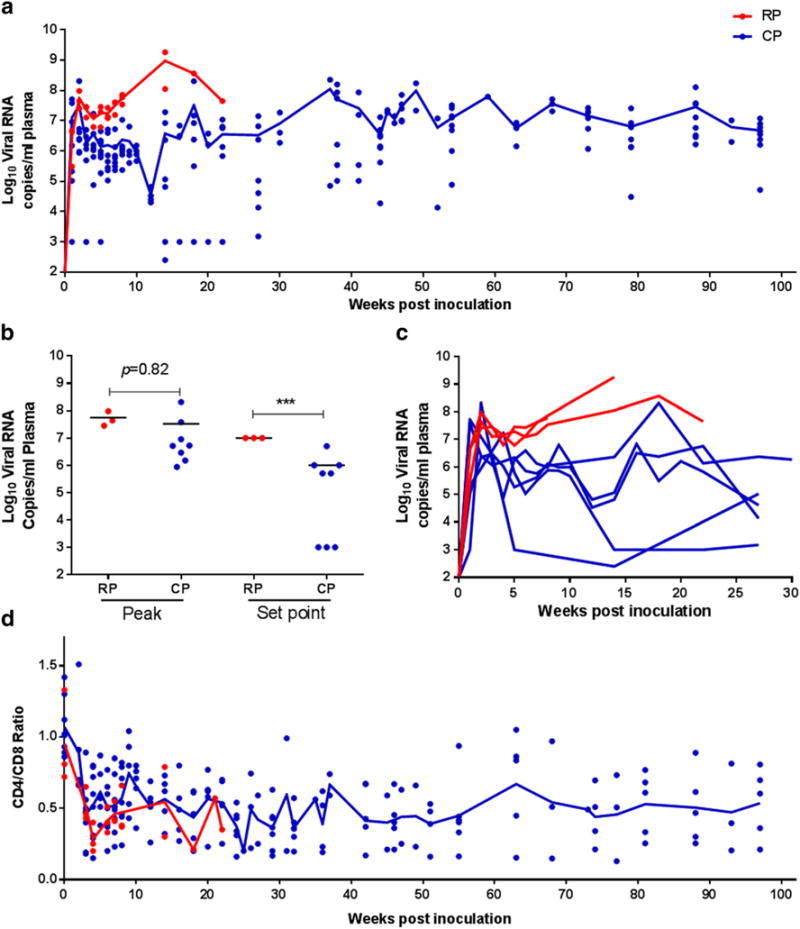
Fig. 1.

Virologic and immunologic parameters in SIVmac239-infected macaques a. Comparison of the changes in viral load in RP and CP macaques over the course of infection (100 weeks). b. Comparison of peak and set point between RP and CP macaques. Asterisks (***) indicates statistical significance (p < 0.001). c. Kinetics of virus dissemination within the first 30 weeks of infection in RP and CP macaques. d. Comparison of changes in CD4/CD8 ratios in RP and CP macaques over the course of infection (100 weeks). Trend lines in a and d were created using median viral load or CD4/CD8 ratio of RP (n = 3) and CP (n = 8) macaques at each time point
